Revised reference curves for bone mineral content and areal bone mineral density according to age and sex for black and non-black children: results of the bone mineral density in childhood study
- PMID: 21917867
- PMCID: PMC3200252
- DOI: 10.1210/jc.2011-1111
Revised reference curves for bone mineral content and areal bone mineral density according to age and sex for black and non-black children: results of the bone mineral density in childhood study
Erratum in
- J Clin Endocrinol Metab. 2013 Jan;98(1):420
Abstract
Context: Deficits in bone acquisition during growth may increase fracture risk. Assessment of bone health during childhood requires appropriate reference values relative to age, sex, and population ancestry to identify bone deficits.
Objective: The objective of this study was to provide revised and extended reference curves for bone mineral content (BMC) and areal bone mineral density (aBMD) in children.
Design: The Bone Mineral Density in Childhood Study was a multicenter longitudinal study with annual assessments for up to 7 yr.
Setting: The study was conducted at five clinical centers in the United States.
Participants: Two thousand fourteen healthy children (992 males, 22% African-Americans) aged 5-23 yr participated in the study.
Intervention: There were no interventions.
Main outcome measures: Reference percentiles for BMC and aBMD of the total body, lumbar spine, hip, and forearm were obtained using dual-energy x-ray absorptiometry for Black and non-Black children. Adjustment factors for height status were also calculated.
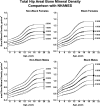
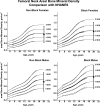
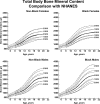
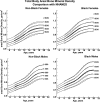
Results: Extended reference curves for BMC and aBMD of the total body, total body less head, lumbar spine, total hip, femoral neck, and forearm for ages 5-20 yr were constructed relative to sex and age for Black and non-Black children. Curves are similar to those previously published for 7-17 year olds. BMC and aBMD values were greater for Black vs. non-Black children at all measurement sites.
Conclusions: We provide here dual-energy x-ray absorptiometry reference data on a well-characterized cohort of 2012 children and adolescents. These reference curves provide the most robust reference values for the assessment and monitoring of bone health in children and adolescents in the literature to date.
Figures


Similar articles
-
Revised reference curves of bone mineral density according to age and sex for Iranian children and adolescents.Arch Osteoporos. 2018 Nov 19;13(1):132. doi: 10.1007/s11657-018-0546-1. Arch Osteoporos. 2018. PMID: 30456732
-
The bone mineral density in childhood study: bone mineral content and density according to age, sex, and race.J Clin Endocrinol Metab. 2007 Jun;92(6):2087-99. doi: 10.1210/jc.2006-2553. Epub 2007 Feb 20. J Clin Endocrinol Metab. 2007. PMID: 17311856
-
Reference Ranges for Bone Mineral Content and Density by Dual Energy X-Ray Absorptiometry for Young Children.J Clin Endocrinol Metab. 2022 Aug 18;107(9):e3887-e3900. doi: 10.1210/clinem/dgac323. J Clin Endocrinol Metab. 2022. PMID: 35587453 Free PMC article.
-
Bone deficits in children and youth with type 1 diabetes: A systematic review and meta-analysis.Bone. 2022 Oct;163:116509. doi: 10.1016/j.bone.2022.116509. Epub 2022 Jul 29. Bone. 2022. PMID: 35914713 Review.
-
Does Exercise Influence Pediatric Bone? A Systematic Review.Clin Orthop Relat Res. 2015 Nov;473(11):3658-72. doi: 10.1007/s11999-015-4467-7. Epub 2015 Jul 25. Clin Orthop Relat Res. 2015. PMID: 26208606 Free PMC article. Review.
Cited by
-
Pediatrics: Measuring pediatric BMD-the bar raised but the glass half full.Nat Rev Endocrinol. 2011 Nov 22;8(1):5-6. doi: 10.1038/nrendo.2011.205. Nat Rev Endocrinol. 2011. PMID: 22105020
-
Reproducibility and intermethod reliability of a calcium food frequency questionnaire for use in Hispanic, non-Hispanic Black, and non-Hispanic White youth.J Acad Nutr Diet. 2015 Apr;115(4):519-27.e2. doi: 10.1016/j.jand.2014.12.016. Epub 2015 Feb 12. J Acad Nutr Diet. 2015. PMID: 25683819 Free PMC article.
-
Amalgamated Reference Data for Size-Adjusted Bone Densitometry Measurements in 3598 Children and Young Adults-the ALPHABET Study.J Bone Miner Res. 2017 Jan;32(1):172-180. doi: 10.1002/jbmr.2935. Epub 2016 Sep 7. J Bone Miner Res. 2017. PMID: 27490028 Free PMC article.
-
Cross-sectional and longitudinal associations between the 24-hour movement behaviours, including muscle and bone strengthening activity, with bone and lean mass from childhood to adolescence.BMC Public Health. 2024 Jan 19;24(1):227. doi: 10.1186/s12889-024-17711-x. BMC Public Health. 2024. PMID: 38238707 Free PMC article. Clinical Trial.
-
Efavirenz is associated with higher bone mass in South African children with HIV.AIDS. 2016 Oct 23;30(16):2459-2467. doi: 10.1097/QAD.0000000000001204. AIDS. 2016. PMID: 27427876 Free PMC article. Clinical Trial.
References
-
- Bachrach L, Levine M, Cowell C, Shaw N. 2007. Clinical indications for the use of DXA in pediatrics. In: Sawyer A, Barchrach L, Fung EB. eds. Bone densitometry in growing patients. Totowa, NJ: Humana Press; 59–72
-
- Gordon CM, Bachrach LK, Carpenter TO, Crabtree N, El-Hajj Fuleihan G, Kutilek S, Lorenc RS, Tosi LL, Ward KA, Ward LM, Kalkwarf HJ. 2008. Dual energy X-ray absorptiometry interpretation and reporting in children and adolescents: the 2007 ISCD Pediatric Official Positions. J Clin Densitom 11:43–58 - PubMed
-
- Leonard MB, Zemel BS. 2002. Current concepts in pediatric bone disease. Pediatr Clin North Am 49:143–173 - PubMed
-
- Kalkwarf HJ, Zemel BS, Gilsanz V, Lappe JM, Horlick M, Oberfield S, Mahboubi S, Fan B, Frederick MM, Winer K, Shepherd JA. 2007. The bone mineral density in childhood study: bone mineral content and density according to age, sex, and race. J Clin Endocrinol Metab 92:2087–2099 - PubMed
-
- Zemel BS, Leonard MB, Kelly A, Lappe JM, Gilsanz V, Oberfield S, Mahboubi S, Shepherd JA, Hangartner TN, Frederick MM, Winer KK, Kalkwarf HJ. 2010. Height adjustment in assessing dual energy x-ray absorptiometry measurements of bone mass and density in children. J Clin Endocrinol Metab 95:1265–1273 - PMC - PubMed
Publication types
MeSH terms
Grants and funding
LinkOut - more resources
Full Text Sources
Other Literature Sources
Medical

