. 2011 Apr 28;70(2):339-51.
doi: 10.1016/j.neuron.2011.02.045.

mGluR5 and NMDA receptors drive the experience- and activity-dependent NMDA receptor NR2B to NR2A subunit switch

Affiliations

mGluR5 and NMDA receptors drive the experience- and activity-dependent NMDA receptor NR2B to NR2A subunit switch

Jose A Matta et al. Neuron. .

Abstract

In cerebral cortex there is a developmental switch from NR2B- to NR2A-containing NMDA receptors (NMDARs) driven by activity and sensory experience. This subunit switch alters NMDAR function, influences synaptic plasticity, and its dysregulation is associated with neurological disorders. However, the mechanisms driving the subunit switch are not known. Here, we show in hippocampal CA1 pyramidal neurons that the NR2B to NR2A switch driven acutely by activity requires activation of NMDARs and mGluR5, involves PLC, Ca(2+) release from IP(3)R-dependent stores, and PKC activity. In mGluR5 knockout mice the developmental NR2B-NR2A switch in CA1 is deficient. Moreover, in visual cortex of mGluR5 knockout mice, the NR2B-NR2A switch evoked in vivo by visual experience is absent. Thus, we establish that mGluR5 and NMDARs are required for the activity-dependent NR2B-NR2A switch and play a critical role in experience-dependent regulation of NMDAR subunit composition in vivo.


Figures

Figure 1
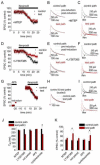
Figure 1. Activity-dependent switch from NR2B- to NR2A-containing NMDARs at hippocampal CA1 pyramidal cell synapses
(A) Summary data of NMDA EPSC peak amplitude vs. time plot for two independent pathways onto the same cell. In one pathway (test; red) the induction protocol was applied, ifenprodil (5 μM) was bath-applied at the time indicated. (B) NMDA EPSCs from example experiments for the test and control pathways taken at the times indicated in A. For this and the other figures, NMDA EPSCs typically didn’t exhibit any change in peak amplitude after the induction protocol and so are shown superimposed with no amplitude rescaling. (C) NMDA EPSCs from an example experiment showing changes in the ifenprodil sensitivity in the control and test paths after application of the induction protocol. (D) Summary graph showing the average values for the weighted time constant (τw) in the control and test paths, before and after the induction protocol (control path: pre-induction = 282 ± 23 ms, post-induction = 277 ± 22 ms; test path: pre-induction = 285 ± 22 ms, post-induction = 218 ± 16 ms). (E) Summary graph for EPSC amplitude in the presence of ifenprodil expressed as percentage of pre-ifenprodil amplitude (control path = 41 ± 4.1 %; test path = 76 ± 6.2 %). n = 15 cells throughout; slices prepared from P5-7 rat; * indicates P < 0.05.
Figure 2
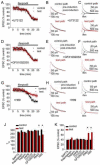
Figure 2. mGluR5 and NMDAR activation are required for the activity-dependent switch in NR2 subunit composition
(A) Summary data of NMDA EPSC peak amplitude vs. time plot for two independent pathways onto the same cell performed in the presence of bath-applied MTEP (10 μM). In one pathway (test; red) the induction protocol was applied, ifenprodil (5 μM) was bath-applied at the time indicated (n = 10). (B) NMDA EPSCs from example experiments for the test and control pathways taken from the experiments in A. (C) NMDA EPSCs from an example experiment showing changes in the ifenprodil sensitivity in the control and test paths after application of the induction protocol. (D-F) As for A-C, but in the presence of LY367385 (100 μM; n = 7). (G-I) As for A-C, but in the presence of D-AP5 (50 μM; n = 8). (J) Summary graph showing the average values for the weighted time constant (τw) in the control and test paths, before and after the induction protocol in the presence of the different antagonists (control path: MTEP = 289 ± 8.2 ms, LY367385 = 298 ± 10.5 ms, not paired = 293 ± 14.3 ms, AP5 = 299 ± 11.2 ms, cycloheximide = 302 ± 13.5 ms; test path: MTEP = 282 ± 9.1 ms, LY367385 = 225 ± 11.8 ms, not paired = 276 ± 16.5 ms, AP5 = 302 ± 13.1 ms, cycloheximide = 228 ± 11.5 ms). (K) Summary graph for EPSC amplitude in the presence of ifenprodil expressed as percentage of pre-ifenprodil amplitude in the presence of the different antagonists (control path: MTEP = 45.2 ± 5.1 %, LY367385 = 42.1 ± 4.9 %, not paired = 41.1 ± 4.8 %, AP5 = 44.4 ± 5.2 %, cycloheximide = 39.5 ± 4.8 %; test path: MTEP = 52.3 ± 6.0 %, LY367385 = 72.1 ± 7.5 %, not paired = 51.5 ± 5.3 %, AP5 = 45.6 ± 4.5 %, cycloheximide = 64.5 ± 6.1 %).
Figure 3
Figure 3. Signaling requirements for the activity-dependent switch in NR2 subunit composition
(A) Summary data of NMDA EPSC peak amplitude vs. time plot for two independent pathways onto the same cell performed in the presence of bath-applied U73122 (5 μM). In one pathway (test; red) the induction protocol was applied, ifenprodil (5 μM) was bath-applied at the time indicated (n = 6). (B) NMDA EPSCs from example experiments for the test and control pathways taken from the experiments in A. (C) NMDA EPSCs from an example experiment showing changes in the ifenprodil sensitivity in the control and test paths after application of the induction protocol. (D-F) As for A-C, but in the presence of GFX109203 (1 μM; n = 8). (G-I) As for A-C, but in the presence of H89 (10 μM; n = 6) (J) Summary graph showing the average values for the weighted time constant (τw) in the control and test paths, before and after the induction protocol in the presence of a number of different antagonists (control path: BAPTA = 280 ± 12 ms, thapsigargin = 298 ± 14 ms, heparin = 278 ± 13 ms, 2APB = 302 ± 11 ms, U73122 = 293 ± 14 ms, GF109203X = 305 ± 10 ms, KN93 = 298 ± 11 ms, H89 = 311 ± 14 ms; test path: BAPTA = 271 ± 9 ms, thapsigargin = 276 ± 16 ms, heparin = 265 ± 14 ms, 2APB = 289 ± 13 ms, U73122 = 286 ± 14 ms, GF109203X = 296 ± 13 ms, KN93 = 228 ± 14 ms, H89 = 241 ± 12 ms). (K) Summary graph for EPSC amplitude in the presence of ifenprodil expressed as percentage of pre-ifenprodil amplitude in the presence of the different antagonists (control path: BAPTA = 39.8 ± 6.2 %, thapsigargin = 42.1 ± 7.9 %, heparin = 38.6 ± 4.3 %, 2APB = 44.9 ± 6.7%, U73122 = 43.9 ± 4.9 %, GF109203X = 43.2 ± 6.9 %, KN93 = 39.6 ± 6.4 %, H89 = 40.3 ± 5.5 %; test path: BAPTA = 40.1 ± 5.0 %, thapsigargin = 49.1 ± 5.7 %, heparin = 40.6 ± 5.6 %, 2APB = 41.6 ± 5.2 %, U73122 = 42.6 ± 3.8 %, GF109203X = 39.5 ± 8.0 %, KN93 = 68.0 ± 7.2 %, H89 = 71.1 ± 6.5 %). Horizontal lines indicate the average value in the control path in absence of pharmacological agents; * indicates P < 0.05. Summary data expressed as average ± sem. BAPTA, 10 mM, n = 6; thapsigargin, 5 μM, n = 7; heparin, 10 mg/mL, n = 6; 2APB, 100 μM, n = 7; GF109203X, 1 μM, n = 8; KN93, 10 μM, n = 7
Figure 4
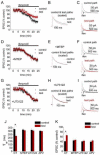
Figure 4. The activity-dependent switch in NR2 subunit composition induced in mouse hippocampal slices
(A) Summary data of NMDA EPSC peak amplitude vs. time plot for two independent pathways onto the same cell performed in mouse hippocampal slice (prepared from P5-7 mouse). In one pathway (test; red) the induction protocol (100 Hz tetanus for 6 s) was applied prior to the start of whole-cell recording, ifenprodil (5 μM) was bath-applied at the time indicated (n = 9). (B) NMDA EPSCs from example experiments for the test and control pathways taken from the experiments in A. (C) NMDA EPSCs from an example experiment showing changes in the ifenprodil sensitivity in the control and test paths after application of the induction protocol. (D-F) As for A-C, but in the presence of MTEP (10 μM; n = 8). (G-I) As for A-C, but in the presence of U73122 (5 μM; n = 7). (J) Summary graph showing the average values for the weighted time constant (τw) in the control and test paths, before and after the induction protocol in control (CT) and in the presence of the different antagonists (control path: CT = 330 ± 20 ms, MTEP = 323 ± 17 ms, U73122 = 318 ± 23 ms, APV = 305 ± 12 ms; test path: CT = 229 ± 14 ms, MTEP = 312 ± 15 ms, U73122 = 307 ± 18 ms, APV = 300 ± 15 ms). (K) Summary graph for EPSC amplitude in the presence of ifenprodil expressed as percentage of pre-ifenprodil amplitude (control path: CT = 41.7 ± 4.1 %, MTEP = 44.9 ± 5.8 %, U73122 = 41.0 ± 3.5 %, APV = 39.5 ± 6.9 %; test path: CT = 66.4 ± 3.3 %, MTEP = 47.4 ± 4.6 %, U73122 = 43.4 ± 6.2 %, APV = 44.6 ± 5.8 %).
Figure 5
Figure 5. Impaired activity-dependent NR2 subunit switch in the mGluR5 knock-out mice
(A) Summary data of NMDA EPSC peak amplitude vs. time plot for two independent pathways onto the same cell performed in hippocampal slice from mGluR5 heterozygous (het) mouse (P5-7). In one pathway (test; red) the induction protocol (100 Hz tetanus for 6 s) was applied prior to the start of whole-cell recording, ifenprodil (5 μM) was bath-applied at the time indicated (n = 16 mice). (B) NMDA EPSCs from example experiments for the test and control pathways taken from the experiments in A. (C) NMDA EPSCs from an example experiment showing changes in the ifenprodil sensitivity in the control and test paths after application of the induction protocol. (D-F) As for A-C, but for mGluR5 knock-out (KO) (n = 9 mice). (G) Summary graph showing the average values for the weighted time constant (τw) in the control and test paths, before and after the induction protocol in mGluR5 heterozygous mice (het) and mGluR5 knock-out (KO) (control path: het = 358 ± 8 ms, KO = 361 ± 14 ms; test path: het = 284 ± 10 ms, KO = 338 ± 29 ms). (H) Summary graph for EPSC amplitude in the presence of ifenprodil expressed as percentage of pre-ifenprodil amplitude (control path: het = 41.0 ± 6.9 %, KO = 37.9 ± 2.6 %; test path: het = 68.2 ± 3.7 %, KO = 52.8 ± 6.5 %).
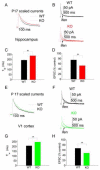
Figure 6
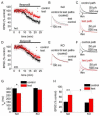
Figure 6. Impaired developmental switch in NR2 subunit composition in hippocampus and primary visual cortex ofmGluR5 knock-out mice
(A) Scaled NMDA EPSCs from hippocampal example experiments taken from wild type (WT, black) and mGluR5 knock-out (KO, red). (B) NMDA EPSCs from hippocampal example experiments taken showing ifenprodil sensitivity. (C) Summary graph showing the average values for the weighted time constant (τw) in wild type (WT) and mGluR5 knock-out (KO) at P15-18 (WT = 195 ± 8 ms, KO = 238 ± 10 ms). (D) Summary graph for EPSC amplitude in the presence of ifenprodil expressed as percentage of pre-ifenprodil amplitude for wild type (WT) and mGluR5 knock-out (KO) at P15-18 (WT = 75.4 ± 4.0 %, KO = 53.0 ± 3.6 %). n = 8 mice (E-H) As for A-D, but for layer 4 inputs onto layer 2/3 pyramidal neurons in primary visual cortex from P15-19 mice (decay kinetics: WT = 209 ± 9 ms, KO = 249 ± 13 ms; ifenprodil sensitivity: WT = 67.4 ± 5.3 %, KO = 48.7 ± 3.4 %). n = 8 mice. *p < 0.05
Figure 7
Figure 7. Impaired sensory-experience switch in the NR2 subunit composition in mGluR5 knock-out mice
(A) Scaled NMDA EPSCs from dark-reared wild type (WT, top) or mGluR5 knock out mice (KO, bottom) without (black trace for WT and green trace for KO) or with (red traces) 2.5 hours light experience (LE). (B) Example traces for ifenprodil sensitivity in dark-reared wild type mice (WT) without light experience (−LE, top) or with light experience (+LE, bottom). (C) Example traces for ifenprodil sensitivity in dark-reared mGluR5 knock-out mice (KO) without light experience (−LE, top) or with light experience (+LE, bottom). (D) Summary graph showing the average values for the weighted time constant (τw) in wild type (WT) and mGluR5 knock-out (KO) with or without LE (WT = 267 ± 18 ms, WT LE = 210 ± 9ms, KO = 271 ± 10 ms, KO LE = 250 ± 8 ms). (E) Summary graph for NMDAR EPSC amplitude in the presence of ifenprodil expressed as percentage of pre-ifenprodil amplitude for wild type (WT) and mGluR5 knock-out (KO) with or without LE (WT = 49.4 ± 3.8 %, WT LE = 61.5 ± 3.7 %, KO = 47.6 ± 3.9 %, KO LE = 53.5 ± 3.6 %). n = 10 animals, *p < 0.05
Figure 8
Figure 8. Mechanism for the activity-dependent switch in NR2 subunit composition
Schematic of a dendritic spine showing the receptors and signaling pathways involved in the activity-dependent NR2 subunit switch. The pharmacological agents used to block the activity-dependent switch are also shown.

Similar articles

Cited by

References

    1. Barria A, Malinow R. Subunit-specific NMDA receptor trafficking to synapses. Neuron. 2002;35:345–353. - PubMed
    1. Barria A, Malinow R. NMDA receptor subunit composition controls synaptic plasticity by regulating binding to CaMKII. Neuron. 2005;48:289–301. - PubMed
    1. Bartlett TE, Bannister NJ, Collett VJ, Dargan SL, Massey PV, Bortolotto ZA, Fitzjohn SM, Bashir ZI, Collingridge GL, Lodge D. Differential roles of NR2A and NR2B-containing NMDA receptors in LTP and LTD in the CA1 region of two-week old rat hippocampus. Neuropharmacology. 2007;52:60–70. - PubMed
    1. Bashir ZI, Alford S, Davies SN, Randall AD, Collingridge GL. Long-term potentiation of NMDA receptor-mediated synaptic transmission in the hippocampus. Nature. 1991;349:156–158. - PubMed
    1. Bellone C, Nicoll RA. Rapid bidirectional switching of synaptic NMDA receptors. Neuron. 2007;55:779–785. - PubMed

Publication types

MeSH terms

Substances

LinkOut - more resources