The carnivorous pale pitcher plant harbors diverse, distinct, and time-dependent bacterial communities
- PMID: 20097807
- PMCID: PMC2838028
- DOI: 10.1128/AEM.02440-09
The carnivorous pale pitcher plant harbors diverse, distinct, and time-dependent bacterial communities
Abstract
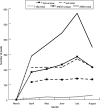
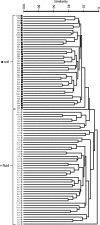
The ability of American carnivorous pitcher plants (Sarracenia) to digest insect prey is facilitated by microbial associations. Knowledge of the details surrounding this interaction has been limited by our capability to characterize bacterial diversity in this system. To describe microbial diversity within and between pitchers of one species, Sarracenia alata, and to explore how these communities change over time as pitchers accumulate and digest insect prey, we collected and analyzed environmental sequence tag (454 pyrosequencing) and genomic fingerprint (automated ribosomal intergenic spacer analysis and terminal restriction fragment length polymorphism) data. Microbial richness associated with pitcher plant fluid is high; more than 1,000 unique phylogroups were identified across at least seven phyla and 50 families. We documented an increase in bacterial diversity and abundance with time and observed repeated changes in bacterial community composition. Pitchers from different plants harbored significantly more similar bacterial communities at a given time point than communities coming from the same genetic host over time. The microbial communities in pitcher plant fluid also differ significantly from those present in the surrounding soil. These findings indicate that the bacteria associated with pitcher plant leaves are far from random assemblages and represent an important step toward understanding this unique plant-microbe interaction.
Figures


Similar articles
-
Selective Bacterial Community Enrichment between the Pitcher Plants Sarracenia minor and Sarracenia flava.Microbiol Spectr. 2021 Dec 22;9(3):e0069621. doi: 10.1128/Spectrum.00696-21. Epub 2021 Nov 24. Microbiol Spectr. 2021. PMID: 34817222 Free PMC article.
-
A keystone predator controls bacterial diversity in the pitcher-plant (Sarracenia purpurea) microecosystem.Environ Microbiol. 2008 Sep;10(9):2257-66. doi: 10.1111/j.1462-2920.2008.01648.x. Epub 2008 May 11. Environ Microbiol. 2008. PMID: 18479443
-
The microbial Phyllogeography of the carnivorous plant Sarracenia alata.Microb Ecol. 2011 May;61(4):750-8. doi: 10.1007/s00248-011-9832-9. Epub 2011 Mar 24. Microb Ecol. 2011. PMID: 21431933
-
Traps of carnivorous pitcher plants as a habitat: composition of the fluid, biodiversity and mutualistic activities.Ann Bot. 2011 Feb;107(2):181-94. doi: 10.1093/aob/mcq238. Epub 2010 Dec 15. Ann Bot. 2011. PMID: 21159782 Free PMC article. Review.
-
Biofilms in lab and nature: a molecular geneticist's voyage to microbial ecology.Int Microbiol. 2010 Mar;13(1):1-7. doi: 10.2436/20.1501.01.105. Int Microbiol. 2010. PMID: 20890834 Review.
Cited by
-
Convergence between the microcosms of Southeast Asian and North American pitcher plants.Elife. 2018 Aug 28;7:e36741. doi: 10.7554/eLife.36741. Elife. 2018. PMID: 30152327 Free PMC article.
-
Selective Bacterial Community Enrichment between the Pitcher Plants Sarracenia minor and Sarracenia flava.Microbiol Spectr. 2021 Dec 22;9(3):e0069621. doi: 10.1128/Spectrum.00696-21. Epub 2021 Nov 24. Microbiol Spectr. 2021. PMID: 34817222 Free PMC article.
-
The hologenome concept of evolution after 10 years.Microbiome. 2018 Apr 25;6(1):78. doi: 10.1186/s40168-018-0457-9. Microbiome. 2018. PMID: 29695294 Free PMC article. Review.
-
Effects of prey, pitcher age, and microbes on acid phosphatase activity in fluid from pitchers of Sarracenia purpurea (Sarraceniaceae).PLoS One. 2017 Jul 18;12(7):e0181252. doi: 10.1371/journal.pone.0181252. eCollection 2017. PLoS One. 2017. PMID: 28719666 Free PMC article.
-
In situ enzyme activity in the dissolved and particulate fraction of the fluid from four pitcher plant species of the genus Nepenthes.PLoS One. 2011;6(9):e25144. doi: 10.1371/journal.pone.0025144. Epub 2011 Sep 16. PLoS One. 2011. PMID: 21949872 Free PMC article.
References
-
- Addicott, J. F. 1974. Predation and prey community structure: experimental study of effect of mosquito larvae on protozoan communities of pitcher plants. Ecology 55:475-492.
-
- Allen, E. B., M. F. Allen, D. J. Helm, J. M. Trappe, R. Molina, and E. Rincon. 1995. Patterns and regulation of mycorrhizal plant and fungal diversity. Plant Soil 170:47-62.
-
- Andrews, J. H., and R. F. Harris. 2000. The ecology and biogeography of microorganisms on plant surfaces. Annu. Rev. Phytopathol. 38:145-180. - PubMed
-
- Andrews, J. H., C. M. Kenerley, and E. V. Nordheim. 1980. Positional variation in phylloplane populations within an apple tree canopy. Microb. Ecol. 6:71-84. - PubMed
-
- Bardgett, R. D., J. L. Mawdsley, S. Edwards, P. J. Hobbs, J. S. Rodwell, and W. J. Davies. 2002. Plant species and nitrogen effects on soil biological properties of temperate upland grasslands. Funct. Ecol. 13:650-660.
Publication types
MeSH terms
Substances
LinkOut - more resources
Full Text Sources

