Comprehensive characterization of genes required for protein folding in the endoplasmic reticulum
- PMID: 19325107
- PMCID: PMC2877488
- DOI: 10.1126/science.1167983
Comprehensive characterization of genes required for protein folding in the endoplasmic reticulum
Abstract
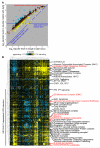
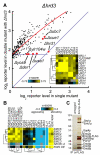
Protein folding in the endoplasmic reticulum is a complex process whose malfunction is implicated in disease and aging. By using the cell's endogenous sensor (the unfolded protein response), we identified several hundred yeast genes with roles in endoplasmic reticulum folding and systematically characterized their functional interdependencies by measuring unfolded protein response levels in double mutants. This strategy revealed multiple conserved factors critical for endoplasmic reticulum folding, including an intimate dependence on the later secretory pathway, a previously uncharacterized six-protein transmembrane complex, and a co-chaperone complex that delivers tail-anchored proteins to their membrane insertion machinery. The use of a quantitative reporter in a comprehensive screen followed by systematic analysis of genetic dependencies should be broadly applicable to functional dissection of complex cellular processes from yeast to human.
Figures


Similar articles
-
The Saccharomyces cerevisiae YFR041C/ERJ5 gene encoding a type I membrane protein with a J domain is required to preserve the folding capacity of the endoplasmic reticulum.Biochim Biophys Acta. 2007 Feb;1773(2):232-42. doi: 10.1016/j.bbamcr.2006.10.011. Epub 2006 Oct 26. Biochim Biophys Acta. 2007. PMID: 17157937 Free PMC article.
-
The Get1/2 transmembrane complex is an endoplasmic-reticulum membrane protein insertase.Nature. 2014 Aug 28;512(7515):441-4. doi: 10.1038/nature13471. Epub 2014 Jul 20. Nature. 2014. PMID: 25043001 Free PMC article.
-
Structural and mechanistic basis of the EMC-dependent biogenesis of distinct transmembrane clients.Elife. 2020 Nov 25;9:e62611. doi: 10.7554/eLife.62611. Elife. 2020. PMID: 33236988 Free PMC article.
-
Emp47p and its close homolog Emp46p have a tyrosine-containing endoplasmic reticulum exit signal and function in glycoprotein secretion in Saccharomyces cerevisiae.Mol Biol Cell. 2002 Jul;13(7):2518-32. doi: 10.1091/mbc.e02-01-0027. Mol Biol Cell. 2002. PMID: 12134087 Free PMC article.
-
Mechanisms of productive folding and endoplasmic reticulum-associated degradation of glycoproteins and non-glycoproteins.Biochim Biophys Acta Gen Subj. 2021 Mar;1865(3):129812. doi: 10.1016/j.bbagen.2020.129812. Epub 2020 Dec 11. Biochim Biophys Acta Gen Subj. 2021. PMID: 33316349 Review.
Cited by
-
Intramembrane client recognition potentiates the chaperone functions of calnexin.EMBO J. 2022 Dec 15;41(24):e110959. doi: 10.15252/embj.2022110959. Epub 2022 Oct 31. EMBO J. 2022. PMID: 36314723 Free PMC article.
-
Frizzled proteins are colonic epithelial receptors for C. difficile toxin B.Nature. 2016 Oct 20;538(7625):350-355. doi: 10.1038/nature19799. Epub 2016 Sep 28. Nature. 2016. PMID: 27680706 Free PMC article.
-
Multiple ER-Golgi SNARE transmembrane domains are dispensable for trafficking but required for SNARE recycling.Mol Biol Cell. 2016 Sep 1;27(17):2633-41. doi: 10.1091/mbc.E16-05-0277. Epub 2016 Jul 6. Mol Biol Cell. 2016. PMID: 27385338 Free PMC article.
-
Protein Quality Control and Lipid Droplet Metabolism.Annu Rev Cell Dev Biol. 2020 Oct 6;36:115-139. doi: 10.1146/annurev-cellbio-031320-101827. Annu Rev Cell Dev Biol. 2020. PMID: 33021827 Free PMC article. Review.
-
Next-generation antimicrobials: from chemical biology to first-in-class drugs.Arch Pharm Res. 2015 Sep;38(9):1702-17. doi: 10.1007/s12272-015-0645-0. Epub 2015 Aug 11. Arch Pharm Res. 2015. PMID: 26259630 Free PMC article. Review.
References
Publication types
MeSH terms
Substances
Grants and funding
LinkOut - more resources
Full Text Sources
Other Literature Sources
Molecular Biology Databases

