A simple method to adjust clinical prediction models to local circumstances
- PMID: 19247740
- PMCID: PMC5487883
- DOI: 10.1007/s12630-009-9041-x
A simple method to adjust clinical prediction models to local circumstances
Abstract
Introduction: Clinical prediction models estimate the risk of having or developing a particular outcome or disease. Researchers often develop a new model when a previously developed model is validated and the performance is poor. However, the model can be adjusted (updated) using the new data. The updated model is then based on both the development and validation data. We show how a simple updating method may suffice to update a clinical prediction model.
Methods: A prediction model that preoperatively predicts the risk of severe postoperative pain was developed with multivariable logistic regression from the data of 1944 surgical patients in the Academic Medical Center Amsterdam, the Netherlands. We studied the predictive performance of the model in 1,035 new patients, scheduled for surgery at a later time in the University Medical Center Utrecht, the Netherlands. We assessed the calibration (agreement between predicted risks and the observed frequencies of an outcome) and discrimination (ability of the model to distinguish between patients with and without postoperative pain). When the incidence of the outcome is different, all predicted risks may be systematically over- or underestimated. Hence, the intercept of the model can be adjusted (updating).
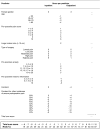
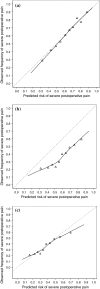
Results: The predicted risks were systematically higher than the observed frequencies, corresponding to a difference in the incidence of postoperative pain between the development (62%) and validation set (36%). The updated model resulted in better calibration.
Discussion: When a clinical prediction model in new patients does not show adequate performance, an alternative to developing a new model is to update the prediction model with new data. The updated model will be based on more patient data, and may yield better risk estimates.
Introduction: Les modèles de prédiction clinique évaluent le risque de présenter ou de manifester un devenir ou une maladie en particulier. Les chercheurs élaborent souvent un nouveau modèle lorsqu’un modèle élaboré précédemment est validé mais que ses performances sont peu concluantes. Toutefois, un modèle peut être ajusté (mis à jour) aux nouvelles données. Le modèle mis à jour est ensuite basé aussi bien sur les données d’élaboration que de validation. Nous montrons comment une méthode simple de mise à jour peut suffire à mettre à jour un modèle de prédiction clinique.
Méthode: Un modèle de prédiction qui prédit avant l’opération le risque de douleur postopératoire grave a été élaboré à l’aide de la méthode de régression logistique multivariée appliquée aux données de 1944 patients chirurgicaux du Centre médical universitaire d’Amsterdam, aux Pays-Bas. Nous avons étudié la performance prédictive du modèle chez 1 035 nouveaux patients qui devaient subir une chirurgie plus tard au Centre médical universitaire d’Utrecht, aux Pays-Bas. Nous avons évalué le calibrage (accord entre les risques prédits et les fréquences observées d’un devenir) et la discrimination (capacité du modèle de distinguer entre les patients avec ou sans douleurs postopératoires). Lorsque l’incidence du devenir est différente, tous les risques prédits peuvent être systématiquement sur- ou sous-estimés. Ainsi, le point d’intersection du modèle peut être ajusté (mise à jour).
Résultats: Les risques prédits étaient systématiquement plus élevés que les fréquences observées, ce qui correspond à une différence de l’incidence des douleurs postopératoires entre les données d’élaboration (62 %) et celles de validation (36 %). Le modèle mis à jour a généré un meilleur calibrage.
Conclusion: Lorsqu’un modèle de prédiction clinique chez de nouveaux patients ne génère pas une performance adaptée, une alternative à l’élaboration d’un nouveau modèle consiste en la mise à jour du modèle de prédiction avec de nouvelles données. Le modèle mis à jour sera basé sur davantage de données patients, et pourrait donner de meilleures estimations des risques.
Figures


Similar articles
-
The risk of severe postoperative pain: modification and validation of a clinical prediction rule.Anesth Analg. 2008 Oct;107(4):1330-9. doi: 10.1213/ane.0b013e31818227da. Anesth Analg. 2008. PMID: 18806049
-
Updating methods improved the performance of a clinical prediction model in new patients.J Clin Epidemiol. 2008 Jan;61(1):76-86. doi: 10.1016/j.jclinepi.2007.04.018. Epub 2007 Nov 26. J Clin Epidemiol. 2008. PMID: 18083464
-
Perioperative Respiratory Adverse Events in Pediatric Ambulatory Anesthesia: Development and Validation of a Risk Prediction Tool.Anesth Analg. 2016 May;122(5):1578-85. doi: 10.1213/ANE.0000000000001216. Anesth Analg. 2016. PMID: 27101501
-
Methods for updating a risk prediction model for cardiac surgery: a statistical primer.Interact Cardiovasc Thorac Surg. 2019 Mar 1;28(3):333-338. doi: 10.1093/icvts/ivy338. Interact Cardiovasc Thorac Surg. 2019. PMID: 30608590 Review.
-
Statistical Development and Validation of Clinical Prediction Models.Anesthesiology. 2021 Sep 1;135(3):396-405. doi: 10.1097/ALN.0000000000003871. Anesthesiology. 2021. PMID: 34330146 Review.
Cited by
-
Targeting aspirin in acute disabling ischemic stroke: an individual patient data meta-analysis of three large randomized trials.Int J Stroke. 2015 Oct;10(7):1024-30. doi: 10.1111/ijs.12487. Epub 2015 Apr 12. Int J Stroke. 2015. PMID: 25864571 Free PMC article. Review.
-
Predicting mortality in patients treated differently: updating and external validation of a prediction model for nursing home residents with dementia and lower respiratory infections.BMJ Open. 2016 Aug 30;6(8):e011380. doi: 10.1136/bmjopen-2016-011380. BMJ Open. 2016. PMID: 27577584 Free PMC article.
-
External validation of four dementia prediction models for use in the general community-dwelling population: a comparative analysis from the Rotterdam Study.Eur J Epidemiol. 2018 Jul;33(7):645-655. doi: 10.1007/s10654-018-0403-y. Epub 2018 May 8. Eur J Epidemiol. 2018. PMID: 29740780 Free PMC article.
-
Modelling prevalent cardiovascular disease in an urban Indigenous population.Can J Public Health. 2024 Nov;115(Suppl 2):288-300. doi: 10.17269/s41997-022-00669-x. Epub 2022 Aug 9. Can J Public Health. 2024. PMID: 35945472 Free PMC article.
-
Adaptation of clinical prediction models for application in local settings.Med Decis Making. 2012 May-Jun;32(3):E1-10. doi: 10.1177/0272989X12439755. Epub 2012 Mar 16. Med Decis Making. 2012. PMID: 22427369 Free PMC article.
References
MeSH terms
LinkOut - more resources
Full Text Sources
Medical

