Conformational switch of syntaxin-1 controls synaptic vesicle fusion
- PMID: 18703708
- PMCID: PMC3235364
- DOI: 10.1126/science.1163174
Conformational switch of syntaxin-1 controls synaptic vesicle fusion
Abstract
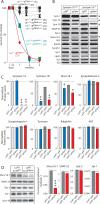
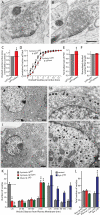
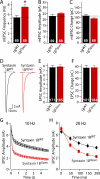
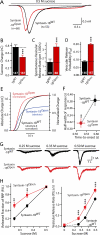
During synaptic vesicle fusion, the soluble N-ethylmaleimide-sensitive factor-attachment protein receptor (SNARE) protein syntaxin-1 exhibits two conformations that both bind to Munc18-1: a "closed" conformation outside the SNARE complex and an "open" conformation in the SNARE complex. Although SNARE complexes containing open syntaxin-1 and Munc18-1 are essential for exocytosis, the function of closed syntaxin-1 is unknown. We generated knockin/knockout mice that expressed only open syntaxin-1B. Syntaxin-1B(Open) mice were viable but succumbed to generalized seizures at 2 to 3 months of age. Binding of Munc18-1 to syntaxin-1 was impaired in syntaxin-1B(Open) synapses, and the size of the readily releasable vesicle pool was decreased; however, the rate of synaptic vesicle fusion was dramatically enhanced. Thus, the closed conformation of syntaxin-1 gates the initiation of the synaptic vesicle fusion reaction, which is then mediated by SNARE-complex/Munc18-1 assemblies.
Figures


Similar articles
-
Munc18-1 binding to the neuronal SNARE complex controls synaptic vesicle priming.J Cell Biol. 2009 Mar 9;184(5):751-64. doi: 10.1083/jcb.200812026. Epub 2009 Mar 2. J Cell Biol. 2009. PMID: 19255244 Free PMC article.
-
Syntaxin-1 N-peptide and Habc-domain perform distinct essential functions in synaptic vesicle fusion.EMBO J. 2013 Jan 9;32(1):159-71. doi: 10.1038/emboj.2012.307. Epub 2012 Nov 27. EMBO J. 2013. PMID: 23188083 Free PMC article.
-
Conformational change of Syntaxin-3b in regulating SNARE complex assembly in the ribbon synapses.Sci Rep. 2022 Jun 3;12(1):9261. doi: 10.1038/s41598-022-09654-3. Sci Rep. 2022. PMID: 35661757 Free PMC article.
-
Neuronal SNARE complex assembly guided by Munc18-1 and Munc13-1.FEBS Open Bio. 2022 Nov;12(11):1939-1957. doi: 10.1002/2211-5463.13394. Epub 2022 Mar 22. FEBS Open Bio. 2022. PMID: 35278279 Free PMC article. Review.
-
Molecular Mechanisms Underlying Neurotransmitter Release.Annu Rev Biophys. 2022 May 9;51:377-408. doi: 10.1146/annurev-biophys-111821-104732. Epub 2022 Feb 15. Annu Rev Biophys. 2022. PMID: 35167762 Free PMC article. Review.
Cited by
-
Syntaxin opening by the MUN domain underlies the function of Munc13 in synaptic-vesicle priming.Nat Struct Mol Biol. 2015 Jul;22(7):547-54. doi: 10.1038/nsmb.3038. Epub 2015 Jun 1. Nat Struct Mol Biol. 2015. PMID: 26030875 Free PMC article.
-
Munc18-1 protein molecules move between membrane molecular depots distinct from vesicle docking sites.J Biol Chem. 2013 Feb 15;288(7):5102-13. doi: 10.1074/jbc.M112.407585. Epub 2012 Dec 6. J Biol Chem. 2013. PMID: 23223447 Free PMC article.
-
Platelet granule exocytosis: a comparison with chromaffin cells.Front Endocrinol (Lausanne). 2013 Jun 26;4:77. doi: 10.3389/fendo.2013.00077. eCollection 2013. Front Endocrinol (Lausanne). 2013. PMID: 23805129 Free PMC article.
-
Sustaining rapid vesicular release at active zones: potential roles for vesicle tethering.Trends Neurosci. 2013 Mar;36(3):185-94. doi: 10.1016/j.tins.2012.10.001. Epub 2012 Nov 17. Trends Neurosci. 2013. PMID: 23164531 Free PMC article. Review.
-
Cell biology of Ca2+-triggered exocytosis.Curr Opin Cell Biol. 2010 Aug;22(4):496-505. doi: 10.1016/j.ceb.2010.05.001. Epub 2010 Jun 3. Curr Opin Cell Biol. 2010. PMID: 20561775 Free PMC article. Review.
References
Publication types
MeSH terms
Substances
Grants and funding
LinkOut - more resources
Full Text Sources
Other Literature Sources
Molecular Biology Databases
Research Materials

