Case Reports
. 2008 Jun 1;111(11):5380-9.
doi: 10.1182/blood-2007-07-099473. Epub 2008 Jan 3.

Band 3 Courcouronnes (Ser667Phe): a trafficking mutant differentially rescued by wild-type band 3 and glycophorin A

Affiliations
Case Reports

Band 3 Courcouronnes (Ser667Phe): a trafficking mutant differentially rescued by wild-type band 3 and glycophorin A

Ashley M Toye et al. Blood. .

Abstract

We describe a mutation in human erythrocyte band 3 (anion exchanger 1; SLC4A1) causing both hereditary spherocytosis and distal renal tubular acidosis. The proband developed a transfusion-dependent, hemolytic anemia following birth. Immunoblotting showed band 3 was reduced to approximately 35% of wildtype; other proteins of the band 3/Rh macrocomplex were also reduced. DNA sequence analysis revealed a novel homozygous mutation, c.2000C>T, leading to the amino acid substitution Ser667Phe. The parents were heterozygous for the same mutation. Sulfate influx in the patient's erythrocytes was approximately 40% wild type. The mutant band 3 produced very little chloride influx when expressed in Xenopus oocytes. Influx was partially rescued by coexpression of glycophorin A and also rescued by coexpression of wild-type band 3. At 2 years of age, an ammonium chloride challenge showed the child has incomplete distal renal tubular acidosis (dRTA). Stable expression of mutant kidney band 3 in both nonpolarized and polarized Madin-Darby canine kidney cells showed that most of the mutant protein was retained in the endoplasmic reticulum. Overall our results suggest that the Ser667Phe does not affect the anion transport function of band 3, but causes a trafficking defect in both erythrocytes and kidney cells.


Figures
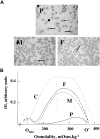
Figure 1
Figure 1
Blood smears and osmotic gradient ektacytometry. Blood smears (A) and osmotic gradient ektacytometry (B). (A) P indicates proband. Many red blood cells were spherocytes (➡). The remaining showed further changes, as if some fragmentation had occurred. There was a pronounced anisocytosis. A few red cells verged on stomatocytes (→). Erythroblasts were present (17%). F indicates father. Presence of many spherocytes without anisocytosis. M indicates mother. Presence of many spherocytes without anisocytosis. (B) In both parents (M and F), there was an increased osmotic fragility, a reduced maximum deformability index, and a decreased dehydration, a situation typical of HS. These features were dramatically enhanced in the proband (P). C indicates control. The maximum deformability index (DImax; normal values, 0.41-0.53 AU) is the maximum value of the deformability index. The “hypo-osmotic point” (Omin; normal values, 143-163 mOsm/L) is the osmolality at which the deformability index reaches a minimum in the hypotonic region; it is the same as the osmolality at which 50% of the erythrocytes hemolyze in a standard osmotic resistance test. This index thus provides a measure of the average surface area–to-volume ratio of erythrocytes. The “hyper-osmotic point” (O′; normal values, 325-375 mOsm/L) is the osmolality in the hypertonic region (right leg of the curve) at which the deformability index reaches half its maximum value. It provides information on the erythrocyte hydration.
Figure 2
Figure 2
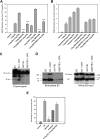
Coomassie and immunostaining of erythrocyte membrane proteins. Erythrocyte membranes were separated on 10% Laemmli gels and immunoblotted using antibodies as shown. Loading C1, C2, controls 1 and 2, respectively. P indicates proband. (A) Proteins of the band 3 complex: immunoblotting used the monoclonal antibody BRIC170 (N-terminal band 3) and antipeptide antibodies against C-terminal of protein 4.2 and GPA. (B) Proteins of the Rh complex: immunoblotting used antipeptide antibodies against C-terminal of RhAG, Rh polypeptides, and CD47. (C) Proteins of the glycophorin C (GPC) complex: immunoblotting used antipeptide antibodies against C-terminal of GPC and GPD, protein 4.1, and p55. Other proteins: immunoblotting used monoclonal antibodies anti–β-actin (Abcam), BRIC235 (CD44), and BRIC221 (Lu), and an antipeptide antibody against C-terminal aquaporin (AQP1). All antibodies used as described in “Erythrocyte membrane protein analysis.”
Figure 3
Figure 3
DIDS titration of sulfate transport. The influx of [35S]sulfate into the cells was measured at 10% hematocrit in isotonic citrate buffer (84 mM sodium citrate, 1 mM EGTA, 4 mM sodium sulfate [pH 6.5]). Influx was determined after 5 minutes at 30°C in the presence of different concentrations of DIDS. The lines show the results of linear regression analysis of the data. ● indicates control; ○, mother; and ▵, patient.
Figure 4
Figure 4
Chloride influx and surface assays in Xenopus oocytes. Band 3 cRNA (B3), kidney band 3 cRNA (kB3), S667F band 3 cRNA (S667F-B3), or S667F kidney band 3 cRNA (S667F-kB3) was injected into Xenopus oocytes either alone or coinjected with GPA or band 3 at concentrations indicated. DNDS-sensitive chloride influx (1 hour) was measured 24 hours after injection with the cRNA using groups of 12 to 15 oocytes. Results are shown as means plus or minus SEM. Significance level is for comparisons of influx between B3 and S667F-B3, or B3 plus GPA and S667F-B3 plus GPA, or kB3 and S667F-kB3, or kB3 plus GPA and S667F-kB3 plus GPA (sample by Student t test; ***P < .001). For the chymotrypsin assay and the biotinylation assay, oocytes were injected with 5 ng of B3 or S667F-B3 and 1.5 ng of GPA and allowed to express protein for 24 hours. The oocytes were then subjected to a chymotrypsin assay or biotinylated as outlined in “Cell-surface protease assay and biotinylation of oocytes.” (A) S667F-B3 has very little chloride influx when expressed alone in oocytes, and this is incompletely rescued by coexpression of GPA in both S667F-B3 and S667F-kB3 to approximately 50% of wild-type B3 + GPA or kB3 + GPA. (B) Comparison of the effects of coexpression of 0.015 to 1.5 ng GPA cRNA on normal B3 and S667F-B3 chloride influx. Although GPA dose-dependently increased wild-type chloride influx, the enhancement effect of GPA was observed to be maximal at 0.15 ng with S667F-B3 (representative of 3 independent experiments) and was saturated. (C,D) Representative chymotrypsin and biotinylation blots after 24 hours' expression using anti–band 3 C-terminal antibody BRIC155 to detect B3. The chymotrypsin gel was loaded with 10 oocytes per lane and is representative of 2 separate experiments conducted in duplicate. The biotinylation assay used material from 3 immunoprecipitations (10 oocytes per IP), and the biotinylated fraction from this pooled material was isolated using strepavidin beads (representative of 2 separate experiments). One-twentieth of the input from the 3 IPs is also shown. Both methods confirm that GPA increases the level of wild-type B3 at the cell surface as previously reported, but only a small amount of S667F-B3 is detected at the cell surface; this does not appear to increase upon coexpression with GPA under the conditions used. (E) Effects of coexpression of 0.75 ng normal B3 with 0.75 ng S667F-B3 on chloride influx. Results are expressed as percentages of the chloride influx obtained with normal B3 and are shown as means plus or minus SEM. The predicted amount of activity is also shown, which represents the expected contribution of 50% B3 and 50% S667F-B3 chloride influx assuming that each population is independent. This result shows that coexpression of wild-type B3 with S667F-B3 rescues the chloride influx of S667F-B3 beyond the predicted level (representative of 4 independent experiments).
Figure 5
Figure 5
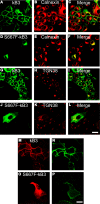
Expression of S667F-kB3 in nonpolarized MDCK1 cells. (A-P) MDCK1 cells stably expressing normal kB3 or mutant S667F-kB3 that were grown on coverslips and fixed (A-L), or washed, incubated with the extracellular anti–band 3 antibody BRIC6 for 1 hour, and then fixed (M-P) as outlined in “Methods.” (A-L) Comparison of kB3 and S667F-kB3 localization with intracellular markers for the ER (calnexin) or TGN (TGN38). kB3 had only a partial overlap with the ER marker (merge; panel C) and some overlap with TGN38 (merge; panel I); most of the protein is at plasma membrane as previously reported. The majority of mutant S667F-kB3 immunoreactive protein overlapped with the calnexin (merge; panel F), but there was some overlap with the TGN38 staining (merge; panel L), suggesting that a small proportion of the protein reaches the late stages of the secretory pathway. (M-P) rbB3Ct staining (M,O) and BRIC6 staining (N,P). All cells expressing wild-type kB3 (confirmed by double staining with the rbB3Ct: panel M) are labeled with substantial amount of FITC-BRIC6 (N). Cells expressing S667F-kB3, which were detected with the rbB3Ct antibody (O), also bound a small amount of FITC-BRIC6 (P), suggesting that a small amount of S667F-kB3 can reach the plasma membrane. Scale bar equals 30 μm.
Figure 6
Figure 6
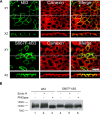
Polarized expression of S667F-kB3 in MDCK1 cells and endoglycosidases treatment. (A) MDCK1 cells stably expressing kB3 or S667F-kB3 that were allowed to polarize for 3 days; their protein expression was induced with sodium butyrate and fixed as described in “Methods.” The cells were then double-labeled with anti–band 3 mouse monoclonal BRIC170 and a rabbit antibody to calnexin, and the bound antibodies were detected with suitable goat anti-mouse or anti-rabbit secondary antibodies and imaged using confocal microscopy. The top panels (XY) show a view parallel to the epithelium, with the BRIC170 image, calnexin, and merged images. The images below (XZ) show a perpendicular view of BRIC170, calnexin, and the merged image of the same epithelium, as represented by the white line in the XY image. kB3 did not overlap with calnexin distribution, and is localized to the basolateral membrane. In contrast, the majority of the S667F-kB3 immunoreactive protein overlaps with the localization of calnexin in polarized cells. Scale bar equals 30 μM. (B) Western blot of kB3 or S667F-kB3 proteins immunoprecipitated with rbB3Ct from one confluent 10-cm2 plate of cells induced with sodium butyrate and treated with either nothing, Endo H (removes high mannose glycosylation), and PNGase (removes complex glycosylation). The immunoprecipitated proteins were eluted and detected by Western blotting using anti–band 3 BRIC170. Normal kB3 protein is complex glycosylated, as evidenced by a diffuse band present in lane 1, which is insensitive to Endo H treatment (lane 2) but runs as a lower-molecular-weight after treatment with PNGase (lane 3). In contrast, S667F-kB3 does not have a diffuse band (lane 4) and is sensitive to Endo H (compare lane 4 with 5), suggestive of high mannose glycosylation only, and consistent with this protein being retained in the ER.

Similar articles

Cited by

References

    1. Tanner MJA. Band 3 anion exchanger and its involvement in erythrocyte and kidney disorders. Curr Opin Hematol. 2002;9:133–139. - PubMed
    1. Gallagher PG, Forget BG. Hematologically important mutations: band 3 and protein 4. 2 variants in hereditary spherocytosis. Blood Cells Mol Dis. 1997;23:417–421. - PubMed
    1. Wrong O, Bruce LJ, Unwin RJ, Toye AM, Tanner MJ. Band 3 mutations, distal renal tubular acidosis, and Southeast Asian ovalocytosis. Kidney Int. 2002;62:10–19. - PubMed
    1. Toye AM. Defective kidney anion-exchanger 1 (AE1, Band 3) trafficking in dominant distal renal tubular acidosis (dRTA). Biochem Soc Symp. 2005;72:47–63. - PubMed
    1. Peters LL, Shivdasani RA, Liu SC, et al. Anion exchanger 1 (Band 3) is required to prevent erythrocyte surface loss but not to form the membrane skeleton. Cell. 1996;86:917–927. - PubMed

Publication types

MeSH terms

Substances