. 2004 Mar;15(3):990-1002.
doi: 10.1091/mbc.e03-09-0687. Epub 2003 Dec 10.

Epidermolysis bullosa simplex-type mutations alter the dynamics of the keratin cytoskeleton and reveal a contribution of actin to the transport of keratin subunits

Affiliations

Epidermolysis bullosa simplex-type mutations alter the dynamics of the keratin cytoskeleton and reveal a contribution of actin to the transport of keratin subunits

Nicola Susann Werner et al. Mol Biol Cell. 2004 Mar.

Abstract

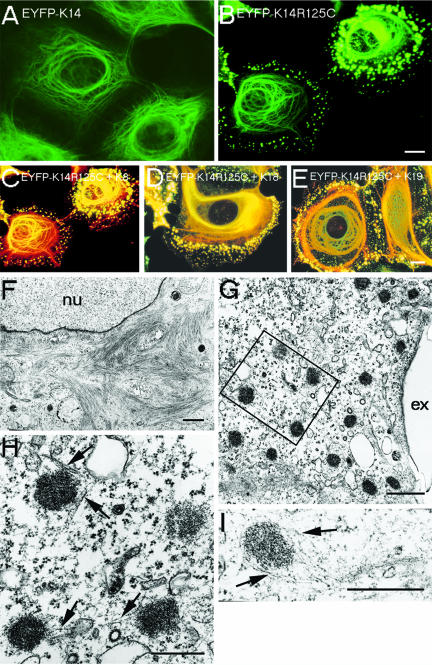
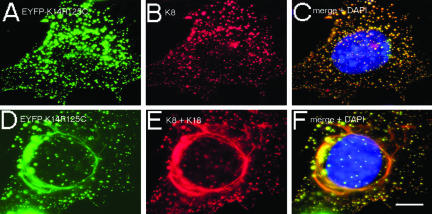
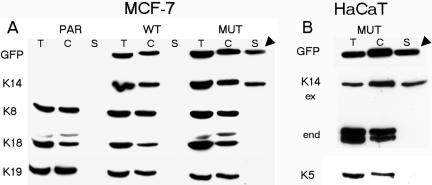
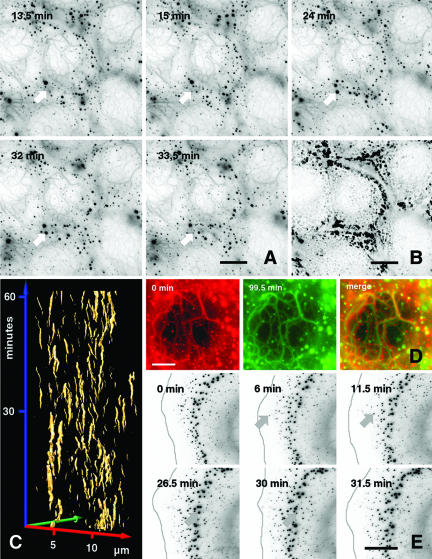
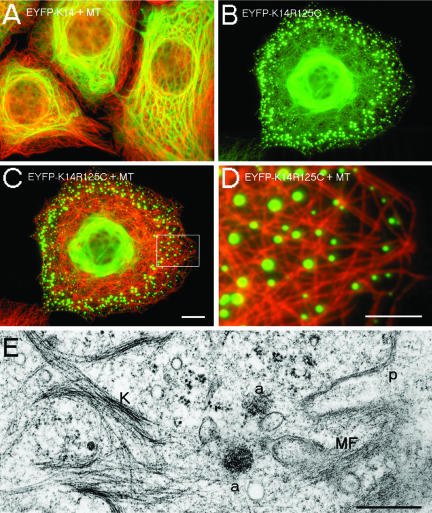
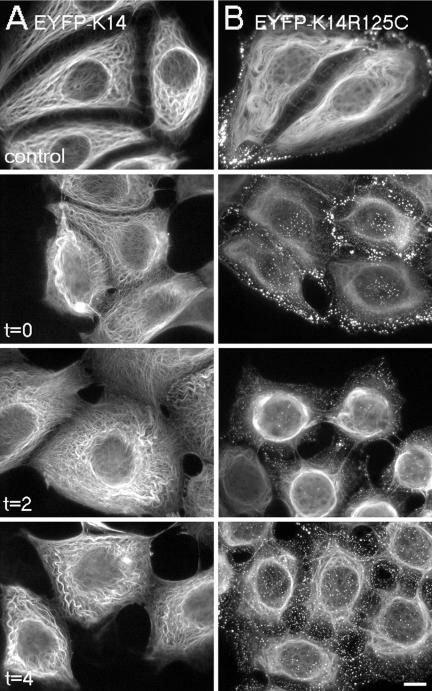
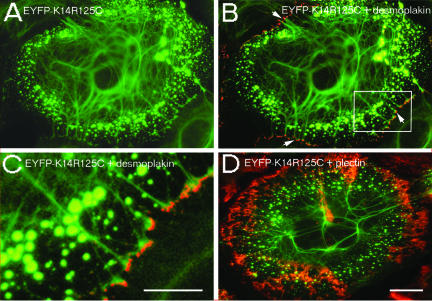
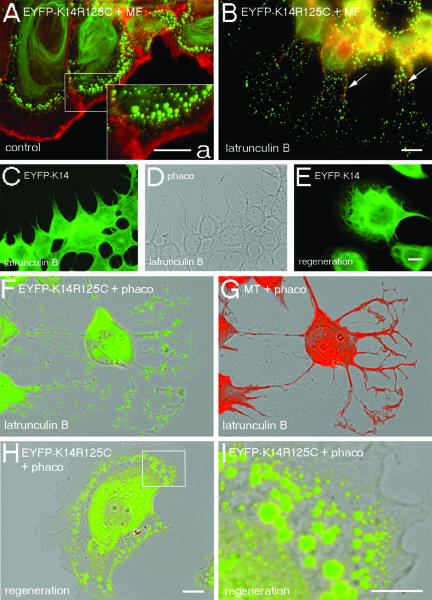
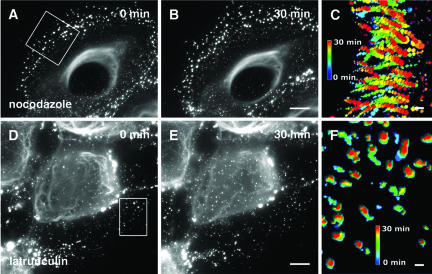
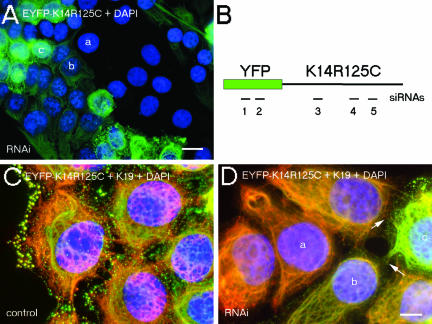
Dominant keratin mutations cause epidermolysis bullosa simplex by transforming keratin (K) filaments into aggregates. As a first step toward understanding the properties of mutant keratins in vivo, we stably transfected epithelial cells with an enhanced yellow fluorescent protein-tagged K14R125C mutant. K14R125C became localized as aggregates in the cell periphery and incorporated into perinuclear keratin filaments. Unexpectedly, keratin aggregates were in dynamic equilibrium with soluble subunits at a half-life time of <15 min, whereas filaments were extremely static. Therefore, this dominant-negative mutation acts by altering cytoskeletal dynamics and solubility. Unlike previously postulated, the dominance of mutations is limited and strictly depends on the ratio of mutant to wild-type protein. In support, K14R125C-specific RNA interference experiments resulted in a rapid disintegration of aggregates and restored normal filaments. Most importantly, live cell inhibitor studies revealed that the granules are transported from the cell periphery inwards in an actin-, but not microtubule-based manner. The peripheral granule zone may define a region in which keratin precursors are incorporated into existing filaments. Collectively, our data have uncovered the transient nature of keratin aggregates in cells and offer a rationale for the treatment of epidermolysis bullosa simplex by using short interfering RNAs.


Figures

Figure 1.
Figure 1.
Double fluorescence and transmission electron microscopy of wt and mut MCF-7 cells. Stable expression of EYFP-K14 (A), EYFP-K14R125C (B); merged images of EYFP-K14R125C and indirect immunofluorescence of K8 (C), K18 (D), and K19 (E). Electron microscopy of EYFP-K14R125C cells shows perinuclear filaments (F) and aggregates in the cell periphery (G). (H) Higher magnification of the marked area in F. (I) Single aggregate. The arrows mark keratin filaments in close association with aggregates; nu, nucleus; ex, extracellular. Bars, 10 μm (same magnification in A and B and C–E), 2 μm (F), 1 μm (G), and 0.5 μm (H and I).
Figure 2.
Figure 2.
De novo assembly properties of mut K14 in 3T3-L1 preadipocytes. Double fluorescence analysis of transiently transfected EYFP-K14R125C (A and D), together with K8 (B), or K8 and K18 (E). Merged images with additional 4,6-diamidino-2-phenylindole staining of DNA are presented in C and F. Bar, 10 μm.
Figure 3.
Figure 3.
Western blot analysis of wt and mut epithelial cells. Total protein extracts (T), insoluble cytoskeletal (C), and soluble fractions (S) were prepared from wt or mut EYFP-K14 cells and their corresponding parental cell lines. (A) Immunoblot analysis of MCF-7 (PAR) and transfected wt (WT) and mut (MUT) cells with antibodies to GFP, K14, K8, K18, and K19. (B) Immunoblot analysis of mutant-transfected HaCaT cells with antibodies to GFP, K14, and K5. The grouping of images was arranged from different gels. The arrowheads mark the soluble cytoskeletal fractions containing exclusively mut keratin. ex, exogenous K14; end, endogenous K14.
Figure 4.
Figure 4.
Time-lapse recordings of the mut keratin cytoskeleton. (A) Images taken from a 99.5-min recording (Movie 1) of confluent growing EYFP-K14R125C MCF-7 cells showing continuous turnover of aggregates. At each time point, a stack of six planes was recorded and projected into a single image. For better visualization, an inverse presentation was chosen. The white arrows point to the positions of a single representative aggregate that emerges and disappears during the recording time. Bar, 10 μm. (B) Projection of the first 30 min from Movie 1 into a single picture depicting the area of aggregate turnover. (C) Time space diagram derived from a 60-min sequence of a time-lapse movie showing appearance and disappearance of aggregates in confluent growing EYFP-K14R125C cells (Movie 1). The time is plotted along the blue axis in minutes, whereas the movement in the xy directions is plotted along the red and green axis in micrometers. The golden trajectories represent the surfaces of aggregates and show their emergence and disappearance. (D) Comparison of central filaments from a cell shown in Movie 1, depicting their stability over a time range of 99.5 min. The red and green image, representing the first and last frame of the movie, has been merged. Although aggregates show no overlap, the filaments remain in place during the recording time (yellow). (E) Images taken from a 31.5-min recording of EYFP-K14R125C cells showing continuous turnover and inward movement of aggregates. For better visualization, an inverse presentation was chosen. The gray line represents the cell edge that was edited from bright-field images recorded in parallel. The arrow points to a single representative aggregate that occurs after 6 min, moves during the recording time toward the cell center, and finally disappears. Bars, 10 μm (A and D) and 5 μm (E).
Figure 6.
Figure 6.
Localization of MTs and MFs in wt and mut MCF-7 cells. (A) Merged image of indirect immunofluorescence of MT (red) and EYFP-K14 (green). (B) Detection of EYFP-K14R125C fluorescence in MCF-7 cells. (C) Merged image of indirect immunofluorescence of MT (red) and EYFP-K14R125C (green). (D) Higher magnification of the marked area in C. (E) Electron microscopy of a EYFP-K14R125C cell shows the distribution of keratin filaments (K), aggregates (a), and cortical MFs. p, plasma membrane. Bars, 5 μm (D), 10 μm (A–C), or 0.5 μm (E).
Figure 9.
Figure 9.
Osmotic shock. After incubation of cells in 150 mM urea in phosphate-buffered saline for 10 min, wt and mut cells were immediately fixed (t = 0) or regenerated in growth medium for the time indicated in the figure. (A) wt cells; the arrows mark desmosomes. (B) mut cells. Bar, 10 μm.
Figure 5.
Figure 5.
Localization of desmoplakin and plectin in mut HaCaT cells. (A) Expression of EYFP-K14R125C. (B) Merged image of indirect immunofluorescence of desmoplakin (red) and EYFP-K14R125C (green); the arrows mark the contacts of keratin filaments containing mut protein with desmosomes. (C) Higher magnification of the marked area in B. (D) Merged image of indirect immunofluorescence of plectin (red) and EYFP-K14R125C (green). Bars, 5 μm (C) or 10 μm (A, B, and D).
Figure 8.
Figure 8.
Dependence of keratin IFs from MFs. Double fluorescence analyses of wt and mut MCF-7 cells before (A), after the depolymerization of MFs by 10 μM latrunculin B for 3 h (B–D, F, and G), or after subsequent regeneration of the cytoskeleton in latrunculin B-free culture medium for 1 h (E, H, and I). (A and B) Merged images of EYFP-K14R125C (green) and Alexa 594-phalloidin fluorescence (red); the inset (a) shows a higher magnification of the area within the box in A. (C and E) EYFP-K14 fluorescence. (D) Corresponding phase contrast image. (F and H) Merged images of EYFP-K14R125C fluorescence (green) and the corresponding phase contrast images. (G) Merged images of indirect immunofluorescence of tubulin (red) and the corresponding phase contrast image. (I) Higher magnification of the marked area in H. Bars, 5 μm (a and I) or 10 μm (A–H); same magnification in A, B, F–H, and C–E.
Figure 7.
Figure 7.
Time-lapse recordings of mut MCF-7 cells after treatment with nocodazole (Movie 3) and latrunculin B (Movie 4). Images of nocodazole-treated cells are taken from the first frame (A) and 30 min later (B) of Movie 3 starting 15 min after application of 40 μM nocodazole. The first (D) and the last image (E) of Movie 4 starting 13.5 min after application of 10 μM latrunculin B. (C and F) Visualization of aggregate tracks during the 30- min movie from selected areas (boxes in A and D). All movie frames of the selected areas were projected into single images and color coded in relation to time. Movement of aggregates after nocodazole treatment is shown as dotted lines in C, whereas standstill of aggregates after latrunculin B treatment is indicated by the absence of dotted lines in F. Bars, 10 μm.
Figure 10.
Figure 10.
Suppression of mut keratin by RNAi. Fluorescence analysis of mut MCF-7 cells 96 h after transfection with K14–2 siRNA (A), or before (C) and after transfection with K14R125C siRNA and subsequent indirect immunofluorescence with an antibody against K19 (D). (A) Merged images of EYFP-K14R125C fluorescence (green) and 4,6-diamidino-2-phenylindole-stained DNA (blue). (C and D) Merged images of EYFP-K14R125C (green), K19 fluorescence (red), and 4,6-diamidino-2-phenylindole-stained DNA (blue); the arrows mark desmosomes between mut and suppressed cells. a, b, and c denote untransfected, partially suppressed, and completely suppressed cells, respectively. (B) Schematic view of the EYFP-K14R125C mRNA with the positions of the siRNAs used in the RNAi experiments; the numbers correspond to the sequences given in MATERIALS AND METHODS. Bars, 20 μm (A) and 10 μm (C and D).

Similar articles

Cited by

References

    1. Amann, K.J., and Pollard, T.D. (2001). The Arp2/3 complex nucleates actin filament branches from the sides of pre-existing filaments. Nat. Cell Biol. 3, 306-310. - PubMed
    1. Andra, K., Kornacker, I., Jorgl, A., Zorer, M., Spazierer, D., Fuchs, P., Fischer, I., and Wiche, G. (2003). Plectin-isoform-specific rescue of hemidesmosomal defects in plectin (-/-) keratinocytes. J. Investig. Dermatol. 120, 189-197. - PubMed
    1. Anton-Lamprecht, I., and Schnyder, U.W. (1982). Epidermolysis bullosa herpetiformis Dowling-Meara. Report of a case and pathomorphogenesis. Dermatologica 164, 221-235. - PubMed
    1. Bachant, J.B., and Klymkowsky, M.W. (1996). A nontetrameric species is the major soluble form of keratin in Xenopus oocytes and rabbit reticulocyte lysates. J. Cell Biol. 132, 153-165. - PMC - PubMed
    1. Bader, B.L., Magin, T.M., Freudenmann, M., Stumpp, S., and Franke, W.W. (1991). Intermediate filaments formed de novo from tail-less cytokeratins in the cytoplasm and in the nucleus. J. Cell Biol. 115, 1293-1307. - PMC - PubMed

Publication types

MeSH terms