. 2003 Dec;23(24):9208-21.
doi: 10.1128/MCB.23.24.9208-9221.2003.

Multiple promoters in the WNK1 gene: one controls expression of a kidney-specific kinase-defective isoform

Affiliations

Multiple promoters in the WNK1 gene: one controls expression of a kidney-specific kinase-defective isoform

Celine Delaloy et al. Mol Cell Biol. 2003 Dec.

Abstract

WNK1 is a serine-threonine kinase, the expression of which is affected in pseudohypoaldosteronism type II, a Mendelian form of arterial hypertension. We characterized human WNK1 transcripts to determine the molecular mechanisms governing WNK1 expression. We report the presence of two promoters generating two WNK1 isoforms with a complete kinase domain. Further variations are achieved by the use of two polyadenylation sites and tissue-specific splicing. We also determined the structure of a kidney-specific isoform regulated by a third promoter and starting at a novel exon. This transcript is kinase defective and has a predominant expression in the kidney compared to the other WNK1 isoforms, with, furthermore, a highly restricted expression profile in the distal convoluted tubule. We confirmed that the ubiquitous and kidney-specific promoters are functional in several cells lines and identified core promoters and regulatory elements. In particular, a strong enhancer element upstream from the kidney-specific exon seems specific to renal epithelial cells. Thus, control of human WNK1 gene expression of kinase-active or -deficient isoforms is mediated predominantly through the use of multiple transcription initiation sites and tissue-specific regulatory elements.


Figures

FIG. 1.
FIG. 1.
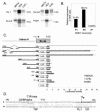
Determination of multiple proximal transcription initiation sites for the human WNK1 gene. (A) Primer extension analysis of total RNAs from human kidney and leukocytes, using a primer complementary to sequences in exon 2. A control reaction was performed with yeast tRNA. Molecular size markers are given on the left. Two major products of 1,200 and 308 bp are indicated by arrows; faint bands around 440, 410, and 390 bp in kidney are indicated by arrowheads. (B) 5′RACE-PCR on heart cDNA with a primer complementary to sequences in the exon (EX) 1 and on kidney cDNA with a primer complementary to sequences in exon 2. Agarose gel electrophoresis of PCR products is shown, with positions of molecular size standards indicated on the left and right. (C) Schematic representation of the multiple transcription initiation sites (bent arrows). Positions are given relative to the first translational start site in exon 1 (ATG +1).
FIG. 2.
FIG. 2.
Comparison of human and mouse WNK1 proximal promoters. Sequences were aligned with the BLAST 2 program. Sequences of the human (h) WNK1 promoters are shown in the top lines of each panel, and sequences of the mouse (m) WNK1 promoters are shown in the bottom lines of each panel. Nucleotide positions are given relative to the first ATG codon of exon 1. (A) Schematic representation of similarities in the proximal 3.5-kb flanking region of the first exon and exon 1 sequences of the WNK1 genes of humans and mice. Percent nucleic acid identities are indicated. (B) Region of the proximal P1 promoter region with the highest level of similarity is shown. (C) Similarities in the flanking translation start sites of the P2 promoters of the human and mouse genes. I, sequence identity; -, gaps. Horizontal lines indicate consensus transcription factor binding sites identified with the TESS program; bent arrows indicate the transcription initiation sites mapped by 5′RACE-PCR. The translation start site for P2 transcripts is in boldface.
FIG. 3.
FIG. 3.
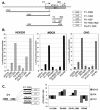
Characterization of the human WNK1 renal promoter (rP). (A) Northern blot analysis of WNK1 expression in cultured cells. Fifteen micrograms of poly(A)+ RNA from MDCK cells, HEK cells, and CHO cells was hybridized with human WNK1 exon 1 (Ex 1) probe (specific for the full-length transcript) (P1), human exon 5-6 probe (specific for both kinase domain-containing and -defective isoforms), or human probe specific for transcripts ending at the second polyadenylation signal (polyA probe). Hybridization with the exon 1 probe revealed two bands, except for MDCK cells. These two bands result from the use of two polyadenylation sites, as shown when the blot was hybridized with the probe specific for the second poly(A) signal: only the larger band is observed. A shorter band appeared for the MDCK cells when exon 5-6 was probed, corresponding to the renal kinase-defective isoform. (B) Endogenous expression of WNK1 isoforms in cultured HEK 293 cells. QRT-PCR was used to quantify WNK1 transcripts. The full-length isoform (under P1 control) was amplified with primers binding to the 5′ sequence of exon 1, both kinase domain-containing isoforms (under P1 and P2 transcriptional control) were amplified with primers binding to exons 2 and 3, and the kidney-specific kinase-defective isoform was amplified with primers binding to exons 4a and 5. Relative expression of the different WNK1 isoforms is shown. (C) Functional analysis of the proximal 5′ flanking region of exon 4a. Reporter constructs containing the indicated lengths of the 5′ rP relative to the transcription initiation site (+1) are indicated on the left. Luciferase activity normalized with respect to that for pGL3-Basic is shown, after the transfection of CHO, HEK 293, or MDCK cells. Histograms represent means, and bars indicate the minima and maxima for at least three experiments. (D) Comparison of human (h.) and mouse (m.) minimal promoter sequences. Sequences were aligned with BLAST 2. I, sequence identity; -, gaps. Lines indicate consensus transcription factor binding sites identified with the TESS program, and the bent arrow indicates the transcription initiation site mapped by 5′RACE-PCR.
FIG. 4.
FIG. 4.
Activity of WNK1 promoters P1 and P2 in cultured cells. (A) Schematic representation of the structural organization of the two proximal WNK1 promoters; 5′ flanking sequences (horizontal lines), the first exon (grey box), main transcription start sites (bent arrows), and the ATG codon corresponding to the translation start site are indicated. Reporter constructs used for luciferase assays are identified, with the length of the promoter of each construct, inserted upstream from the luciferase gene, given relative to the first ATG codon in exon 1. (B) Normalized luciferase activity for constructs containing P1, P2, or both promoters in transfected HEK 293, MDCK, and CHO cells. The relative luciferase activity of pGL3-Basic is considered to be 1. The SV40 promoter served as a positive control. Data are means from at least three experiments. (C) Promoter specificity of the transcriptional effect mediated by the [−2500; −1200] region, tested in three cell lines. The chimeric constructs used are presented schematically on the left; [−2500; −1200] was cloned upstream from the human WNK1 or SV40 promoter. The normalized luciferase activities for these constructs were divided by the activity for the promoter construct without the [−2500; −1200] sequence, resulting in the rate of transcriptional activation mediated by [−2500; −1200].
FIG. 5.
FIG. 5.
Northern blot analysis of human WNK1 transcripts. (A) Schematic representation of the 3′ end of the human WNK1 (hWNK1) gene, showing the locations of two predicted consensus polyadenylation sites (AATAAA) with positions given relative to the stop codon in exon 28. The probe used to discriminate transcripts according to their polyadenylation sites is indicated by a line. UTR, untranslated region. (B) Northern blot of RNAs from multiple human tissues hybridized with a probe complementary to exon 13-18 sequences. RNA size standards are indicated. (C) The same blot hybridized with a probe binding between the two predicted polyadenylation sites.
FIG. 6.
FIG. 6.
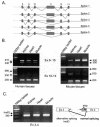
Alternative splicing in human and mouse WNK1 genes. (A) Schematic representation of WNK1 splicing events identified by RT-PCR in various tissues. The genomic segment spanning WNK1 is represented by a horizontal line, exons are represented by numbered grey boxes, and the splicing events are shown by broken lines. Exons 9, 11, and 12 are independently spliced. (B) Agarose gel electrophoresis of RT-PCR products from human, kidney, heart, and skeletal muscle RNAs (left panels) and mouse kidney, heart, and skeletal muscle RNAs (right panels). Amplified exons (Ex), from which primers were chosen, are indicated between the gels. Amplified fragments are indicated by arrows, with sizes given in base pairs. (C) Identification of a rare exon 4 alternative splicing event. Left panel, RT-PCR on human kidney, heart, and skeletal muscle RNAs with primers binding to exons 3 and 4. Right panel, schematic representation of the splicing between exons 3 and 4. The donor splice site (gt) and acceptor splice site (ag) are indicated. The grey box indicates the 83-bp fragment inserted following the rare splicing event (Ins83).
FIG. 7.
FIG. 7.
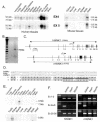
Characterization of the kidney-specific transcript. (A) Northern blot analysis of human (left panels) and mouse (right panels) WNK1 transcripts. Multitissue Northern blots were hybridized with a human WNK1 cDNA probe specific for exon 4 (EX4) (upper panels) or exon 5 (lower panels). (B) 5′RACE-PCR on kidney cDNA, using a primer complementary to sequences in exon 6. Agarose gel electrophoresis of PCR products is shown with molecular size standards indicated on the left and the size of the major band indicated on the right. (C) Comparison of the genomic structures of the human (h) (upper panel) and mouse (m) (lower panel) WNK1 genes. The genomic segment spanning WNK1 is represented by an horizontal line, and exons are indicated by numbered vertical lines. The novel exon 4a is indicated in boldface with the novel renal promoter (rP) (bent arrow). The genomic structure of the mouse gene was deduced from the WGS supercontig NW 000264 (gi: 20832062) and NW 036612 (gi: 20737037), partially sequenced. (D) Comparison of human (top line) and mouse (bottom line) exon 4a coding sequences. Sequences were aligned with BLAST 2 program. I, sequence identity. In-frame ATG codons are underlined. Deduced protein sequences are indicated, with conserved residues in grey. Double lines indicate cysteine-rich regions. (E) Same blots as in panel A; human (upper panel) and mouse (lower panel) multitissue Northern blots were hybridized with an exon 4a-specific probe. (F) Analysis of WNK1 transcripts by RT-PCR on human and mouse kidney, heart, and skeletal muscle RNA templates. The long isoform was amplified with primers specific for human exons 1 and 2 (top panels), whereas the short renal isoform was amplified with primers specific for human exons 4a to 6 (middle panels) and both isoforms were amplified with primers specific for human exons 25 and 26 (bottom panels).
FIG. 8.
FIG. 8.
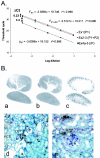
Expression pattern of the WNK1 gene in kidney. (A) Quantification of WNK1 transcripts in human kidney by QRT-PCR. The full-length transcript was amplified with primers binding to exon 1 (Ex1), the kinase domain-containing isoforms were amplified with primers binding to exons 2 and 3, and the kidney-specific kinase-defective isoform was amplified with primers binding to exons 4a and 5. Human kidney cDNA was serially diluted 1/4, and 3 μl of each dilution was used in the PCR assay. Two PCR assays were performed for each dilution. The threshold cycle was measured and plotted against the log of the dilution. (B) In situ hybridization of WNK1 mRNA on a kidney section from an adult mouse. Hybridization with an antisense riboprobe corresponding to the full-length WNK1 isoform (a) and to the kinase domain-containing isoforms (b) shows weak uniform labeling, whereas the probe for the renal isoform (c) shows an intense hybridization signal restricted to the cortex; at high magnification, the labeling can be localized to the DCT (d and e). Asterisks, glomerulus; PCT, proximal convoluted tubule. Magnifications, ×3.5 (a, b, and c), ×100 (d), and ×250 (e).

Similar articles

Cited by

References

    1. Achard, J. M., D. G. Warnock, S. Disse-Nicodeme, B. Fiquet-Kempf, P. Corvol, A. Fournier, and X. Jeunemaitre. 2003. Familial hyperkalemic hypertension: phenotypic analysis in a large family with the WNK1 deletion mutation. Am. J. Med. 114:495-498. - PubMed
    1. Choate, K. A., K. T. Kahle, F. H. Wilson, C. Nelson-Williams, and R. P. Lifton. 2003. WNK1, a kinase mutated in inherited hypertension with hyperkalemia, localizes to diverse Cl-transporting epithelia. Proc. Natl. Acad. Sci. USA 100:663-668. - PMC - PubMed
    1. Chomczynski, P., and N. Sacchi. 1987. Single-step method of RNA isolation by acid guanidinium thiocyanate-phenol-chloroform extraction. Anal. Biochem. 162:156-159. - PubMed
    1. Disse-Nicodeme, S., J. M. Achard, J. Potier, M. Delahousse, B. Fiquet-Kempf, N. Stern, A. Blanchard, J. C. Guilbaud, P. Niaudet, D. Chauveau, B. Dussol, Y. Berland, P. Dequiedt, J. L. Ader, M. Paillard, J. P. Grunfeld, A. Fournier, P. Corvol, and X. Jeunemaitre. 2001. Familial hyperkalemic hypertension (Gordon syndrome): evidence for phenotypic variability in a study of 7 families. Adv. Nephrol. Necker Hosp. 31:55-68. - PubMed
    1. Gordon, R. D., S. A. Klemm, T. J. Tunny, and M. Stowasser. 1995. Gordon's syndrome: a sodium-volume-dependent form of hypertension with a genetic basis, p. 2111-2123. In J. H. Laragh and B. M. Brenner (ed.), Hypertension: pathophysiology, diagnosis and management, 2nd ed. Raven Press, New York, N.Y.

Publication types

MeSH terms

Associated data

LinkOut - more resources