Case Reports
. 2001 Mar;68(3):577-89.
doi: 10.1086/318811. Epub 2001 Feb 9.

Bone dysplasia sclerosteosis results from loss of the SOST gene product, a novel cystine knot-containing protein

Affiliations
Case Reports

Bone dysplasia sclerosteosis results from loss of the SOST gene product, a novel cystine knot-containing protein

M E Brunkow et al. Am J Hum Genet. 2001 Mar.

Abstract

Sclerosteosis is an autosomal recessive sclerosing bone dysplasia characterized by progressive skeletal overgrowth. The majority of affected individuals have been reported in the Afrikaner population of South Africa, where a high incidence of the disorder occurs as a result of a founder effect. Homozygosity mapping in Afrikaner families along with analysis of historical recombinants localized sclerosteosis to an interval of approximately 2 cM between the loci D17S1787 and D17S930 on chromosome 17q12-q21. Here we report two independent mutations in a novel gene, termed "SOST." Affected Afrikaners carry a nonsense mutation near the amino terminus of the encoded protein, whereas an unrelated affected person of Senegalese origin carries a splicing mutation within the single intron of the gene. The SOST gene encodes a protein that shares similarity with a class of cystine knot-containing factors including dan, cerberus, gremlin, prdc, and caronte. The specific and progressive effect on bone formation observed in individuals affected with sclerosteosis, along with the data presented in this study, together suggest that the SOST gene encodes an important new regulator of bone homeostasis.


Figures
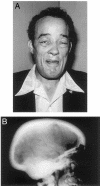
Figure  1
Figure 1
Clinical manifestations of sclerosteosis. A, An adult Afrikaner with the characteristic mandibular overgrowth, facial palsy, and deafness. B, Lateral radiograph of the skull of an affected adult Afrikaner. Gross hyperostosis of the calvarium and base are evident.
Figure  2
Figure 2
Pedigrees of families H and B, showing haplotypes for selected markers at the sclerosteosis locus on chromosome 17q12-21. Alleles are number coded, and the order of the markers from centromere to telomere is according to the Généthon human linkage microsatellite map (Dib et al. 1996). The blackened bars represent the disease haplotype; unblackened and hatched bars represent nondisease haplotypes and indicate parent of origin in the offspring. In H-II.1, the recombination event, which marks the centromeric boundary of the sclerosteosis locus, is shown at marker locus D17S1787. The recombined ancestral haplotype that B-II.1 and B-II.2 have inherited from their father, B-I.1, at D17S930 marks the telomeric boundary of the locus.
Figure  3
Figure 3
Physical map of the sclerosteosis region. Several microsatellite markers from the 17q12-q21 region (e.g., D17S800, D17S1787, D17S1793, D17S855, D17S1789, D17S1860, D17S930, and D17S934) were used simultaneously to screen the human CITB B and C BAC libraries. To resolve discrepancies in marker order observed at the time in publicly available 17q21 maps from the Généthon, CEPH, and GeneBridge Radiation Hybrid mapping efforts, we complemented the construction of BAC contigs with “high-resolution” radiation hybrid analysis on the Stanford TNG mapping panel (Lunetta et al. 1996), using a number of microsatellite markers and novel STSs derived from BAC ends. Genetic analysis of affected families localized the sclerosteosis region to the interval between D17S1787 and D17S930 (boxed). The minimum tiling path across this interval (shown below map) comprised 32 clones; these are labeled according to CITB library ID number, with the exception of clones labeled “Axxxx,” which represent BAC and PAC sequences available in GenBank at the time (full accession numbers are in the format of “AC00xxxx”). A subset of known genes we placed in this interval are indicated on the map; the sclerosteosis candidate gene, SOST, is shown in red and is located within 10 kb of D17S951 on BAC clone 202l9 (lab alias P50). Polymorphic markers are shown in italics; novel microsatellite markers developed as part of this study that further refined the sclerosteosis critical interval are shown in purple. The map is oriented from centromere (cen) to telomere (tel).
Figure  4
Figure 4
Novel predicted P50gsc3 gene contains distinct disease-specific polymorphisms in affected individuals from South Africa and Senegal. The novel gene as predicted by GENSCAN (P50gsc3) includes four coding exons; however, corresponding cDNAs obtained from a number of human tissues differed from the predicted transcript in that they did not include the two internal exons (hatched boxes). Note that the probability scores assigned by GENSCAN to these two internal exons were only .33 and .59, respectively, compared with a score of .99 assigned to both the first and last exons (solid boxes). The single splice donor/splice acceptor pair seen in RT-PCR products did correspond to that of the first and last predicted exons (indicated by ]). A single-base substitution located 69 bp downstream of the predicted translation initiation site (C69T) was found in affected Afrikaners, resulting in termination of translation 23 residues from the amino terminus of P50gsc3. Genomic DNA from the affected Senegalese individual included two substitutions within intronic sequence, located 3 bp (A+3T) and 2,692 bp (A+2692C), respectively, downstream of the first splice-donor site. None of these three polymorphisms was found in ⩾360 unaffected control individuals.
Figure  5
Figure 5
Proximal Senegalese-specific polymorphism affects processing of P50gsc3 transcript in vitro. A, Mammalian expression constructs containing the four forms of the P50gsc3 gene body under the control of the RSV 3’LTR are shown: (1) wt-SOST derived from BAC P50; (2) mut2-SOST, containing the distal A+2692C intronic polymorphism; (3) SDmut-SOST, containing a nucleotide substitution at the donor splice site (G-1T); and (4) mut1-SOST, containing the A+3T intronic polymorphism. Nucleotide positions of the three mutants are numbered relative to the first base of the intron. P50gsc3 coding sequence, including the initiating methionine, is represented by blackened boxes; 3′ UTR (excluding a polyadenylation signal) is represented by unblackened box; heavy horizontal line corresponds to entire 2758 bp intron; the RSV 3′ LTR and polyadenylation signal (pA) elements derived from the expression vector are also indicated. B, After transient transfection of COS-1 cells with the indicated construct, total RNA was recovered and analyzed by northern blot, using a fragment corresponding to the full-length SOST cDNA as a probe. Shown here is one representative blot (the experiment was repeated in triplicate). The quality and concentration of the RNA samples were first ascertained by running 1 μg of each sample on a 1% agarose gel (nondenaturing) and staining with ethidium bromide (below northern blot), then 20 μg of each were used for northern blot analyses. Transcripts deriving from constructs wt-SOST and mut2-SOST were consistently observed at high levels (lanes 1 and 2) and at a size of ∼2.3 kb, indicative of splicing of the intron as shown in 3A. The faint bands at ∼5 kb most likely represent low level of unprocessed transcript. Constructs SDmut-SOST and mut1-SOST consistently resulted in ⩾10-fold lower levels of transcript at a size slightly larger than the processed wt-SOST and mut2-SOST transcripts (lanes 3 and 4). C, When the same RNA samples were subjected to RT-PCR using primers (small arrows) that span the 2758 bp intron, products derived from both the SDmut-SOST and mut1-SOST transfections indicated the use of a cryptic splice-donor site located 214 bases 3′ of that seen in the products from the wt-SOST and mut2-SOST constructs. The sequences at the splice junctions are indicated, the additional 214 bp are shown in gray, and the authentic exonic sequences are solid boxes.
Figure  6
Figure 6
The SOST gene product is highly conserved across vertebrate species. The vervet (v), rat (r), and mouse (m) sclerostin sequences are 98%, 89%, and 88% identical, respectively, to the human (h) sequence. Conserved residues across all four species are highlighted with a black background; residues shared by three species are highlighted in gray. Putative secretory signal sequence is overlined, and potential sites for asparagine (N)-glycosylation are underlined.
Figure  7
Figure 7
The SOST gene is expressed in a tissue-specific manner. Levels of SOST gene expression were determined using the standard curve method (separate tube reactions) on an ABI Prism 7700 detection instrument, in which the PPI (cyclophilin) and DAD1 genes served as endogenous references, and the standard curves were generated from a dilution series of a linear plasmid standard of known concentration. Standard curves were derived by plotting the threshold cycle (CT) vs. starting quantity, in this case expressed in copies/μl, and raw values for each of the three genes were then calculated from the CT of each test sample. Mean values from duplicate reactions for SOST, PPI, and DAD1 were used in subsequent calculations. Two independent normalized SOST values were derived from the ratio of raw mean SOST to raw mean PPI value and raw mean SOST to raw mean DAD1 value, for each tissue sample. Expression in the human tissues indicated are represented by the raw mean SOST values (open bars), SOST values normalized to PPI (solid bars), and SOST values normalized to DAD1 (gray bars).
Figure  8
Figure 8
Sclerostin shares sequence similarity with the dan family of proteins. The cysteine-rich region of the SOST gene product (residues 80–167) is aligned with the analogous regions of proteins encoded by the human DAN, CER1 (cerberus), DRM (gremlin), mouse Prdc, chicken Car (caronte), human NDP, MUC2, VWF, and TGFβ2 genes. The six canonical cysteine residues forming the core of the knot structure, including the CxGxC motif, are numbered 1–6 (highlighted in black), and cysteines that may be involved in additional stabilizing disulfide bonds are labeled a–d, according to Meitinger et al. (1993) (highlighted in gray). Pairwise alignments of the cystine knot motif of sclerostin to each of these other factors show the following percent identities and number of gaps: DAN (22%, 10); CER1 (24%, 10); DRM (20%, 12); Prdc (23%, 12); Car (22%, 10); NDP (18%, 17); MUC2 (15%, 25); VWF (17%, 22); and TGFβ2 (11%, 24).

Similar articles

Cited by

References

Electronic-Database Information

    1. BLAST, http://www.ncbi.nlm.nih.gov/BLAST/
    1. CEPH, http://www.cephb.fr/
    1. Cooperative Human Linkage Center, http://lpg.nci.nih.gov/CHLC/
    1. Coriell Cell Repositories, http://locus.umdnj.edu/
    1. Expressed Sequence Tags database, http://www.ncbi.nlm.nih.gov/dbEST/index.html

References

    1. Balemans W, van den Ende J, Freire Paes-Alves A, Dikkers F, Willems P, Vanhoenacker F, de Almeida-Melo N, Alves CF, Stratakis CA, Hill SC, van Hul W (1999) Localization of the gene for sclerosteosis to the van Buchem disease-gene region on chromosome 17q12-q21. Am J Hum Genet 64:1661–1669 - PMC - PubMed
    1. Beighton P (1988) Sclerosteosis. J Med Genet 25:200–203 - PMC - PubMed
    1. Beighton P, Barnard A, Hamersma H, van der Wouden A (1984) The syndromic status of sclerosteosis and van Buchem disease. Clin Genet 25:175–181 - PubMed
    1. Beighton P, Davidson J, Durr L, Hamersma H (1977) Sclerosteosis—an autosomal recessive disorder. Clin Genet 11:1–7 - PubMed
    1. Beighton P, Durr L, Hamersma H (1976) The clinical features of sclerosteosis: a review of the manifestations in twenty-five affected individuals. Ann Intern Med 84:393–397 - PubMed

Publication types

MeSH terms