

Selective loss of cone function in mice lacking the cyclic nucleotide-gated channel CNG3
- PMID: 10377453
- PMCID: PMC22124
- DOI: 10.1073/pnas.96.13.7553
Selective loss of cone function in mice lacking the cyclic nucleotide-gated channel CNG3
Abstract
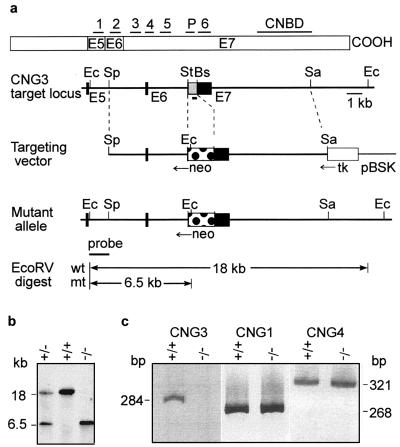
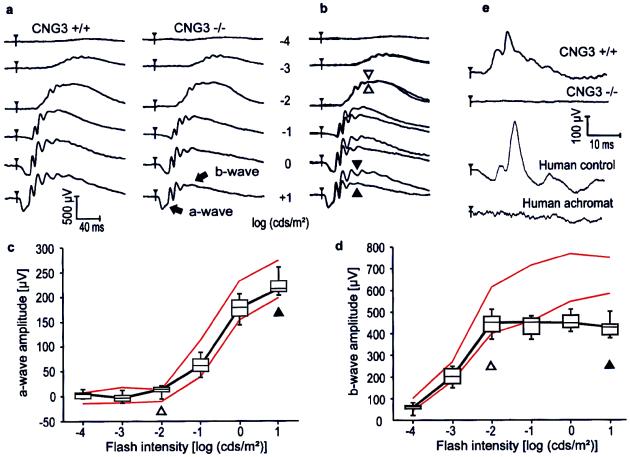
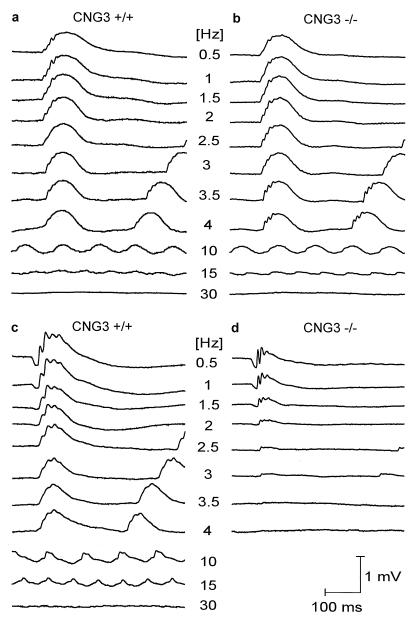
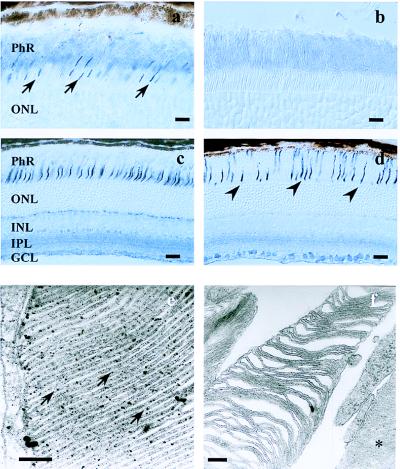
Two types of photoreceptors, rods and cones, coexist in the vertebrate retina. An in-depth analysis of the retinal circuitry that transmits rod and cone signals has been hampered by the presence of intimate physical and functional connections between rod and cone pathways. By deleting the cyclic nucleotide-gated channel CNG3 we have generated a mouse lacking any cone-mediated photoresponse. In contrast, the rod pathway is completely intact in CNG3-deficient mice. The functional loss of cone function correlates with a progressive degeneration of cone photoreceptors but not of other retinal cell types. CNG3-deficient mice provide an animal model to dissect unequivocally the contribution of rod and cone pathways for normal retinal function.
Figures
Similar articles
-
Residual photosensitivity in mice lacking both rod opsin and cone photoreceptor cyclic nucleotide gated channel 3 alpha subunit.Vis Neurosci. 2004 Sep-Oct;21(5):675-83. doi: 10.1017/S0952523804215024. Vis Neurosci. 2004. PMID: 15683556
-
Impaired channel targeting and retinal degeneration in mice lacking the cyclic nucleotide-gated channel subunit CNGB1.J Neurosci. 2005 Jan 5;25(1):130-8. doi: 10.1523/JNEUROSCI.3764-04.2005. J Neurosci. 2005. PMID: 15634774 Free PMC article.
-
Impaired opsin targeting and cone photoreceptor migration in the retina of mice lacking the cyclic nucleotide-gated channel CNGA3.Invest Ophthalmol Vis Sci. 2005 Apr;46(4):1516-24. doi: 10.1167/iovs.04-1503. Invest Ophthalmol Vis Sci. 2005. PMID: 15790924
-
The structure of cyclic nucleotide-gated channels in rod and cone photoreceptors.Trends Neurosci. 2022 Oct;45(10):763-776. doi: 10.1016/j.tins.2022.07.001. Epub 2022 Aug 5. Trends Neurosci. 2022. PMID: 35934530 Review.
-
Cyclic nucleotide-gated ion channels.Physiol Rev. 2002 Jul;82(3):769-824. doi: 10.1152/physrev.00008.2002. Physiol Rev. 2002. PMID: 12087135 Review.
Cited by
-
Endoplasmic reticulum stress-associated cone photoreceptor degeneration in cyclic nucleotide-gated channel deficiency.J Biol Chem. 2012 May 25;287(22):18018-29. doi: 10.1074/jbc.M112.342220. Epub 2012 Apr 9. J Biol Chem. 2012. PMID: 22493484 Free PMC article.
-
Promotion of endoplasmic reticulum retrotranslocation by overexpression of E3 ubiquitin-protein ligase synoviolin 1 reduces endoplasmic reticulum stress and preserves cone photoreceptors in cyclic nucleotide-gated channel deficiency.FASEB J. 2024 Sep 15;38(17):e70021. doi: 10.1096/fj.202400198R. FASEB J. 2024. PMID: 39215566
-
Visual Arrestin 1 contributes to cone photoreceptor survival and light adaptation.Invest Ophthalmol Vis Sci. 2010 May;51(5):2372-80. doi: 10.1167/iovs.09-4895. Epub 2009 Dec 17. Invest Ophthalmol Vis Sci. 2010. PMID: 20019357 Free PMC article.
-
A homologous genetic basis of the murine cpfl1 mutant and human achromatopsia linked to mutations in the PDE6C gene.Proc Natl Acad Sci U S A. 2009 Nov 17;106(46):19581-6. doi: 10.1073/pnas.0907720106. Epub 2009 Nov 3. Proc Natl Acad Sci U S A. 2009. PMID: 19887631 Free PMC article.
-
Melanopsin-expressing retinal ganglion-cell photoreceptors: cellular diversity and role in pattern vision.Neuron. 2010 Jul 15;67(1):49-60. doi: 10.1016/j.neuron.2010.05.023. Neuron. 2010. PMID: 20624591 Free PMC article.
References
Publication types
MeSH terms
Substances
Associated data
- Actions
- Actions
- Actions
LinkOut - more resources
Full Text Sources
Other Literature Sources
Molecular Biology Databases
