

The microbiome and metatranscriptome of a panel from the Sarracenia mapping population reveal complex assembly and function involving host influence
- PMID: 39474216
- PMCID: PMC11518717
- DOI: 10.3389/fpls.2024.1445713
The microbiome and metatranscriptome of a panel from the Sarracenia mapping population reveal complex assembly and function involving host influence
Abstract
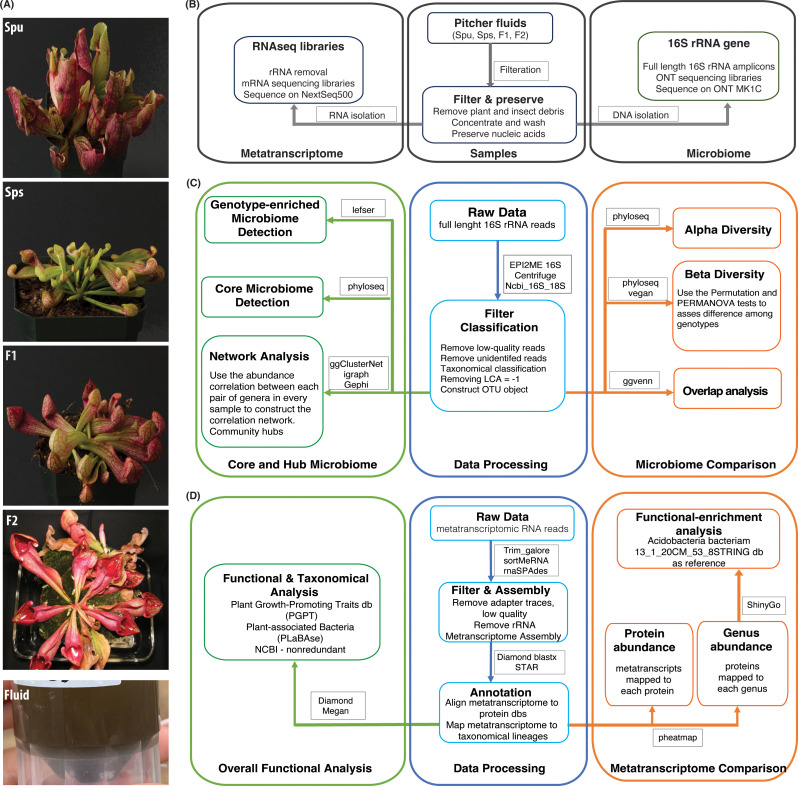
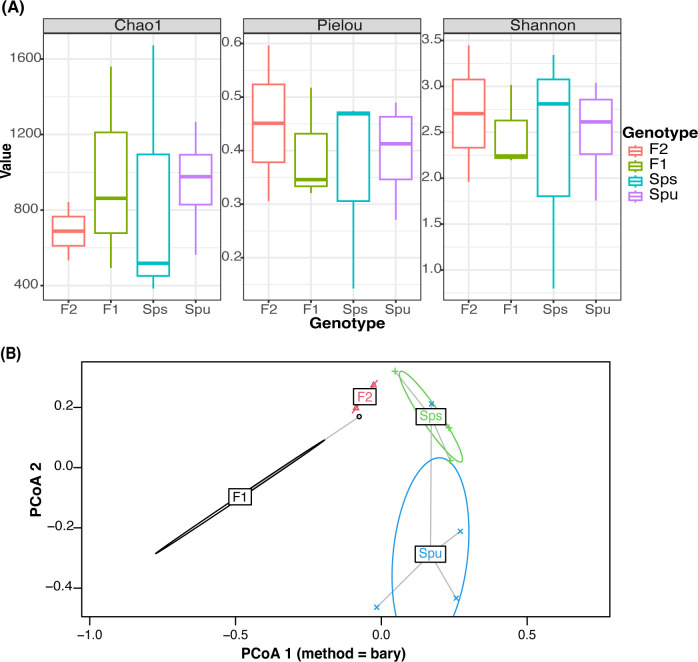
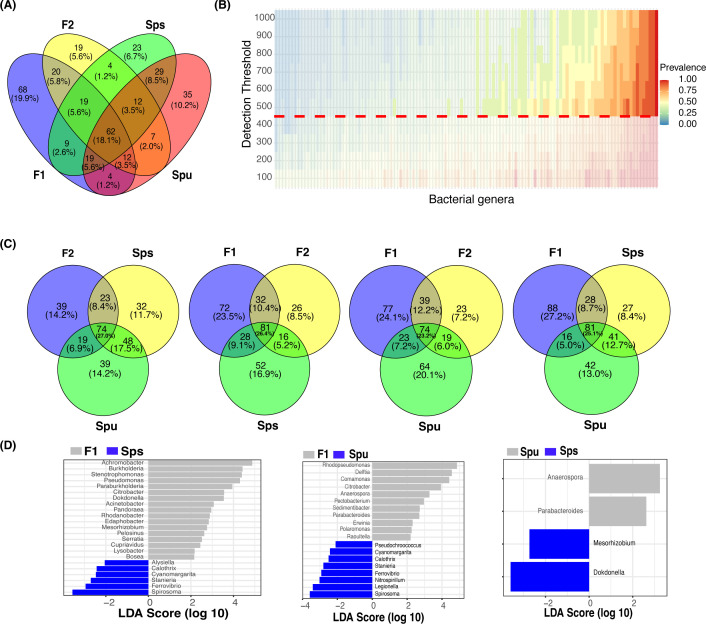
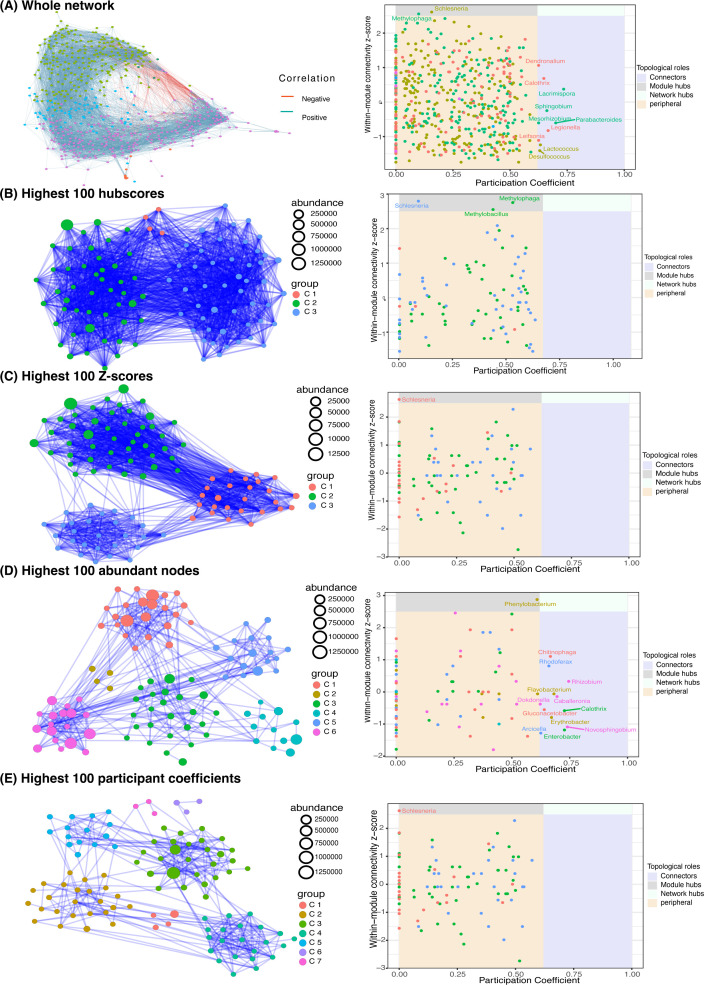
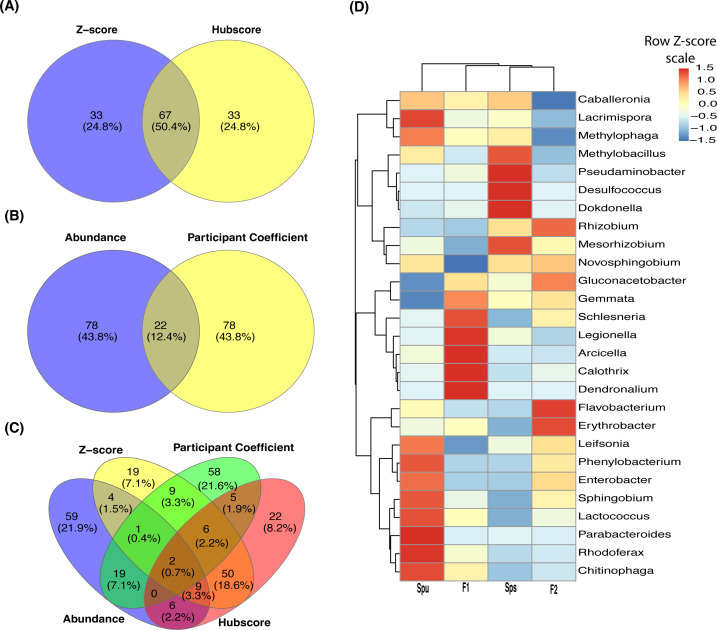
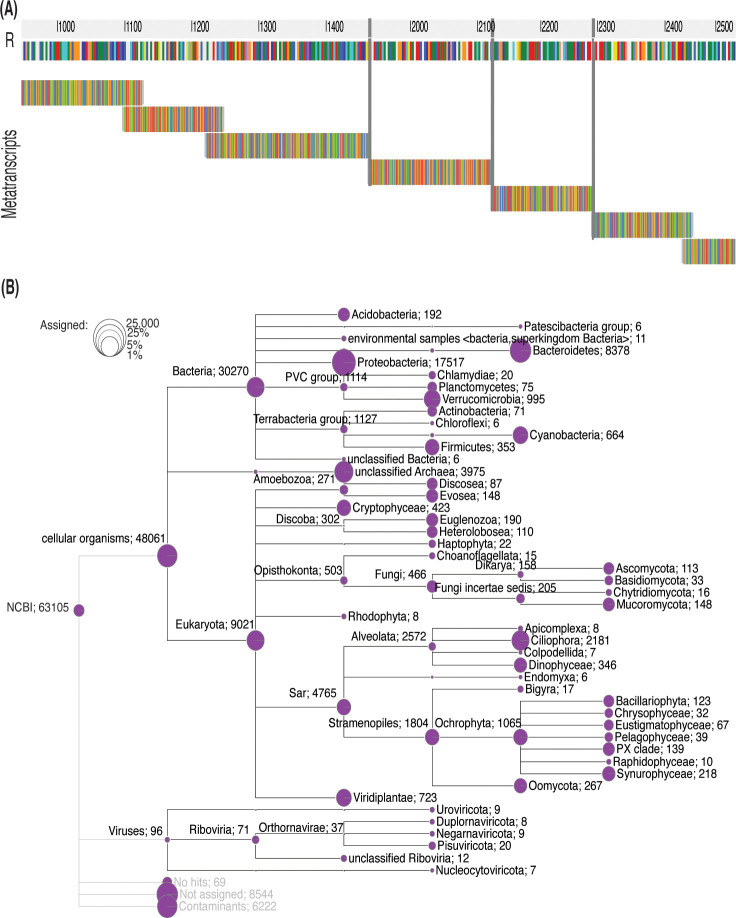
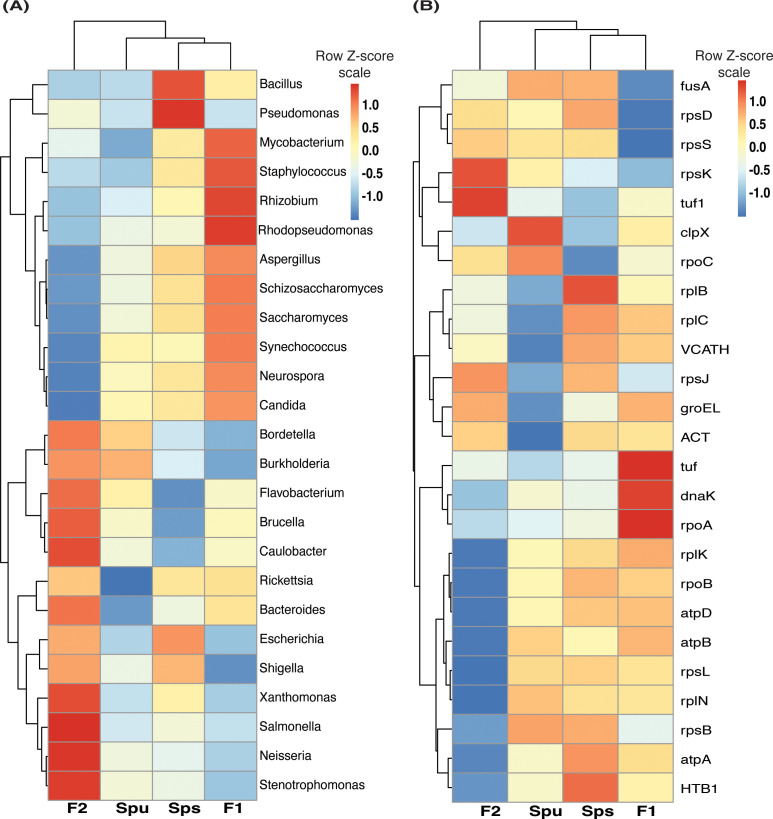
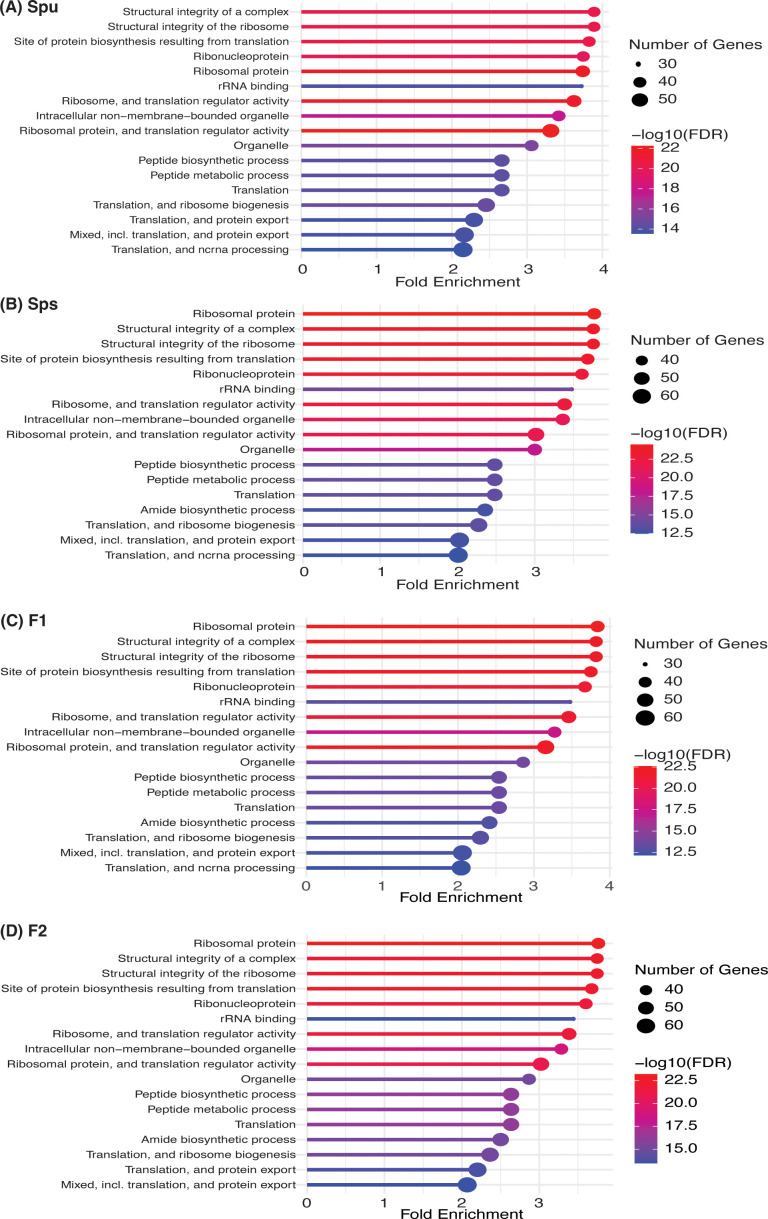
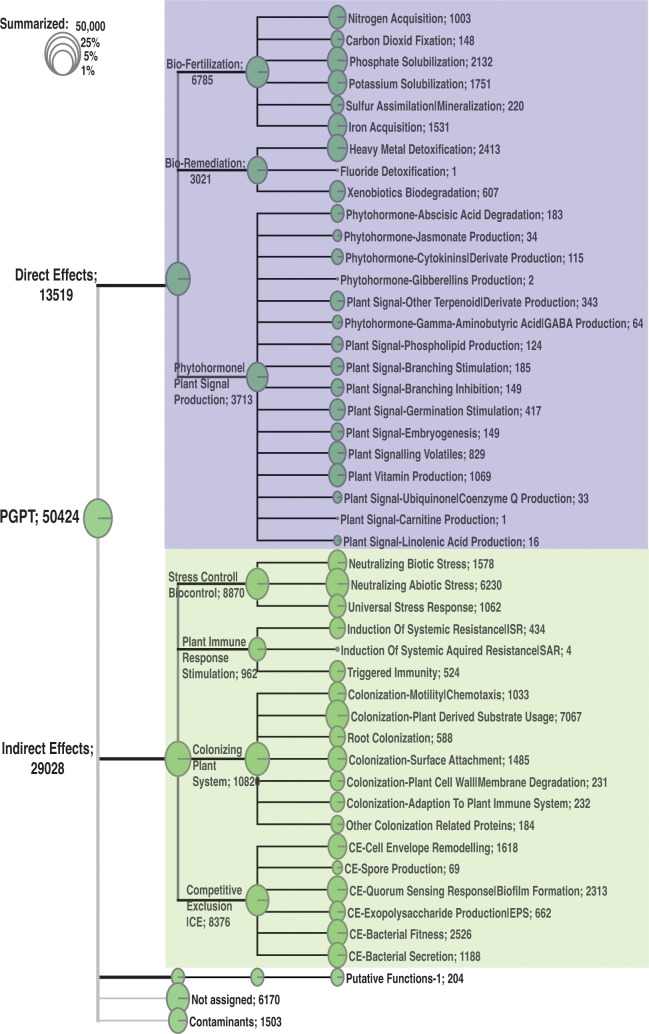
Sarracenia provide an optimal system for deciphering the host-microbiome interactions at various levels. We analyzed the pitcher microbiomes and metatranscriptomes of the parental species, and F1 and F2 generations from the mapping population (Sarracenia purpurea X Sarracenia psittacina) utilizing high-throughput sequencing methods. This study aimed to examine the host influences on the microbiome structure and function and to identify the key microbiome traits. Our quality datasets included 8,892,553 full-length bacterial 16s rRNA gene sequences and 65,578 assembled metatranscripts with microbial protein annotations. The correlation network of the bacterial microbiome revealed the presence of 3-7 distinct community clusters, with 8 hub and 19 connector genera. The entire microbiome consisted of viruses, bacterial, archaea, and fungi. The richness and diversity of the microbiome varied among the parental species and offspring genotypes despite being under the same greenhouse environmental conditions. We have discovered certain microbial taxa that are genotype-enriched, including the community hub and connector genera. Nevertheless, there were no significant differences observed in the functional enrichment analysis of the metatranscriptomes across the different genotypes, suggesting a functional convergence of the microbiome. We found that the pitcher microcosm harbors both rhizosphere and phyllosphere microbiomes within its boundaries, resulting in a structurally diverse and functionally complex microbiome community. A total of 50,424 microbial metatranscripts were linked to plant growth-promoting microbial proteins. We show that this complex pitcher microbiome possesses various functions that contribute to plant growth promotion, such as biofertilization, bioremediation, phytohormone signaling, stress regulation, and immune response stimulation. Additionally, the pitcher microbiome exhibits traits related to microbe-microbe interactions, such as colonization of plant systems, biofilm formation, and microbial competitive exclusion. In summary, the demonstrated taxonomical divergence and functionally convergence of the pitcher microbiome are impacted by the host genetics, making it an excellent system for discovering novel beneficial microbiome traits.
Keywords: carnivorous plants; metatranscriptome; microbiome; pitcher plant; plant-microbiome interaction; sarracenia; structural and functional core microbiome.
Copyright © 2024 Cai, Mohsin, Rogers, Zhang, Jiang, Malmberg and Alabady.
Conflict of interest statement
The authors declare that the research was conducted in the absence of any commercial or financial relationships that could be construed as a potential conflict of interest.
Figures
Similar articles
-
Diverse microbial communities hosted by the model carnivorous pitcher plant Sarracenia purpurea: analysis of both bacterial and eukaryotic composition across distinct host plant populations.PeerJ. 2019 Feb 18;7:e6392. doi: 10.7717/peerj.6392. eCollection 2019. PeerJ. 2019. PMID: 30805246 Free PMC article.
-
Selective Bacterial Community Enrichment between the Pitcher Plants Sarracenia minor and Sarracenia flava.Microbiol Spectr. 2021 Dec 22;9(3):e0069621. doi: 10.1128/Spectrum.00696-21. Epub 2021 Nov 24. Microbiol Spectr. 2021. PMID: 34817222 Free PMC article.
-
Bacterial Recruitment to Carnivorous Pitcher Plant Communities: Identifying Sources Influencing Plant Microbiome Composition and Function.Front Microbiol. 2022 Mar 14;13:791079. doi: 10.3389/fmicb.2022.791079. eCollection 2022. Front Microbiol. 2022. PMID: 35359741 Free PMC article.
-
Traps of carnivorous pitcher plants as a habitat: composition of the fluid, biodiversity and mutualistic activities.Ann Bot. 2011 Feb;107(2):181-94. doi: 10.1093/aob/mcq238. Epub 2010 Dec 15. Ann Bot. 2011. PMID: 21159782 Free PMC article. Review.
-
Microbial Community and Function-Based Synthetic Bioinoculants: A Perspective for Sustainable Agriculture.Front Microbiol. 2022 Mar 11;12:805498. doi: 10.3389/fmicb.2021.805498. eCollection 2021. Front Microbiol. 2022. PMID: 35360654 Free PMC article. Review.
References
-
- Anderson M. J. (2001). A new method for non-parametric multivariate analysis of variance. Austral Ecol. 26, 32–46. doi: 10.1111/j.1442-9993.2001.01070.pp.x - DOI
Grants and funding
LinkOut - more resources
Full Text Sources
Miscellaneous