. 2024 Nov;300(11):107820.
doi: 10.1016/j.jbc.2024.107820. Epub 2024 Sep 27.

Nonfunctional coq10 mutants maintain the ERMES complex and reveal true phenotypes associated with the loss of the coenzyme Q chaperone protein Coq10

Affiliations

Nonfunctional coq10 mutants maintain the ERMES complex and reveal true phenotypes associated with the loss of the coenzyme Q chaperone protein Coq10

Noelle Alexa Novales et al. J Biol Chem. 2024 Nov.

Abstract

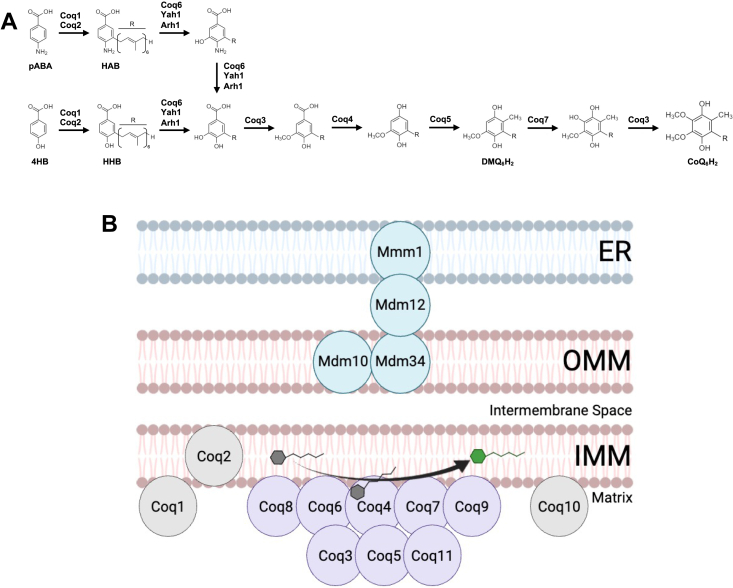
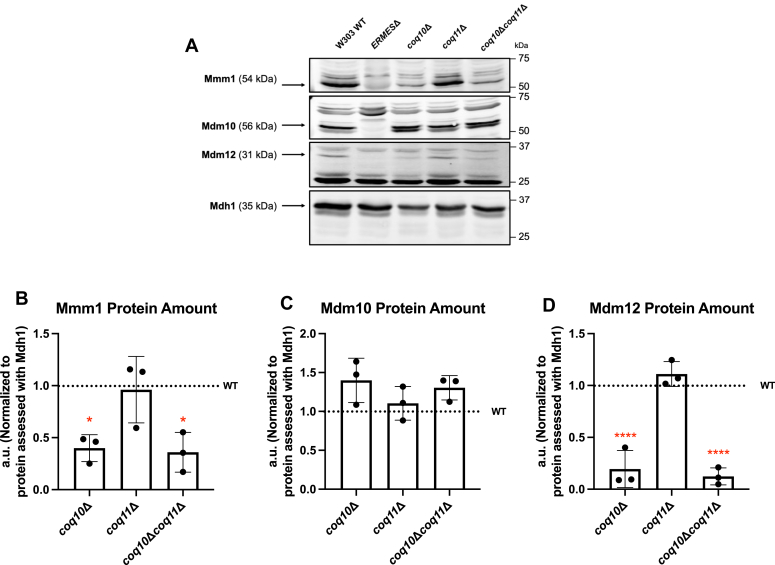
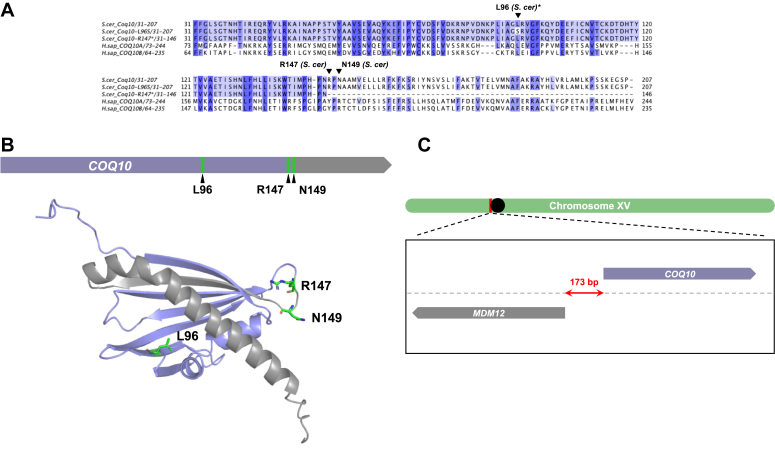
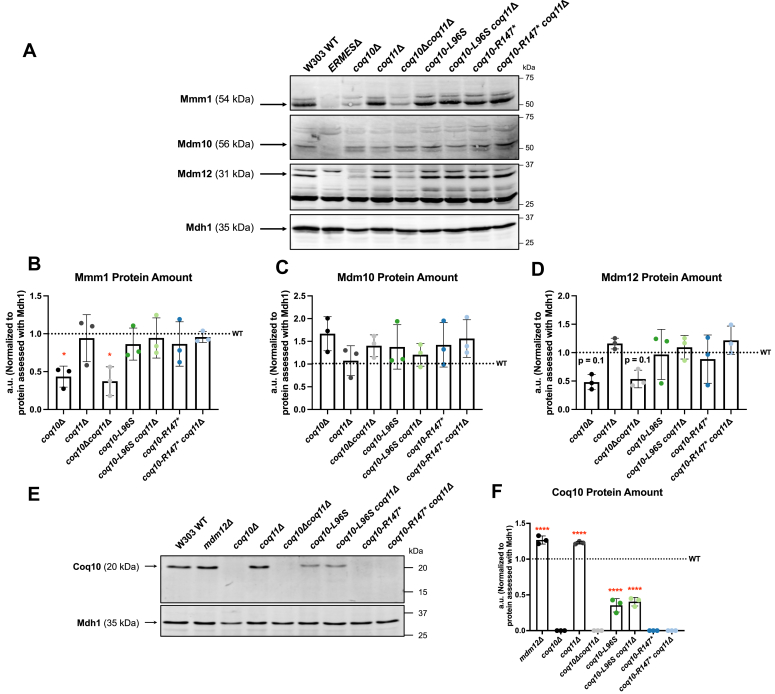
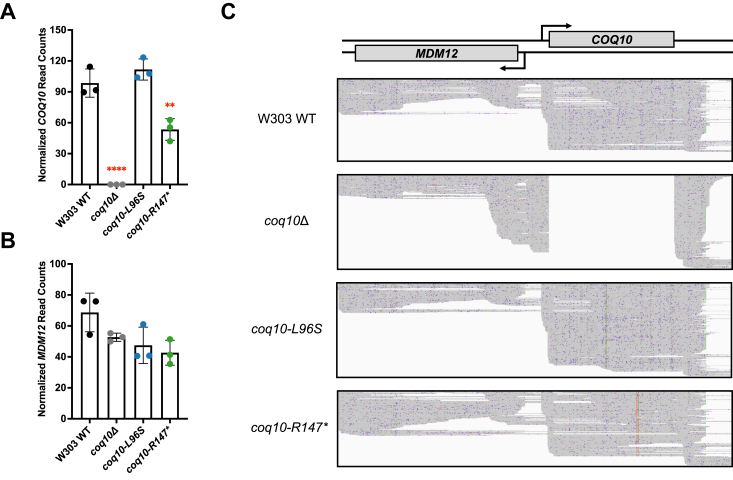
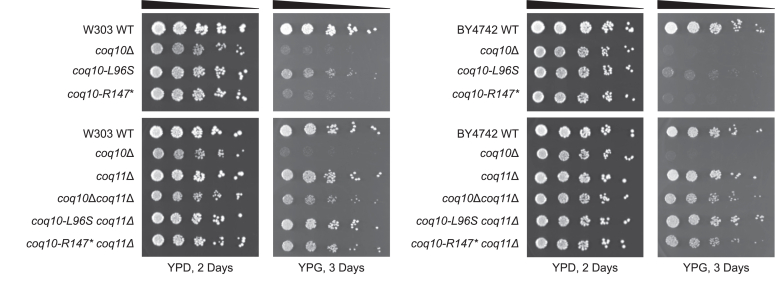
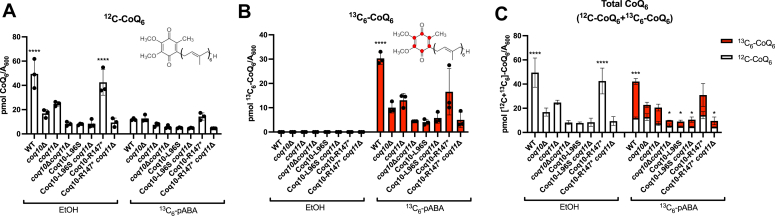
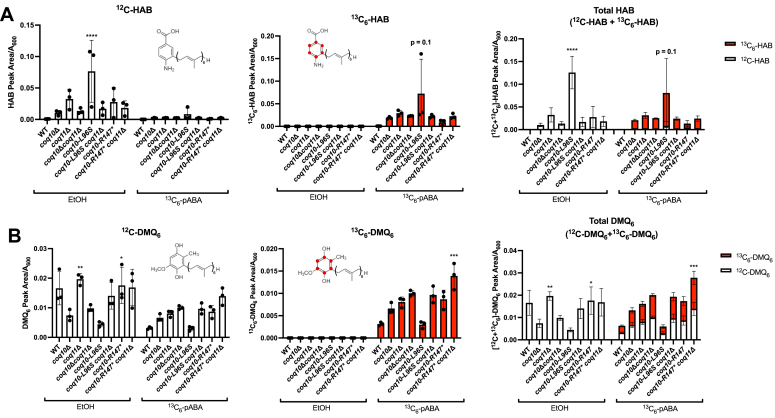
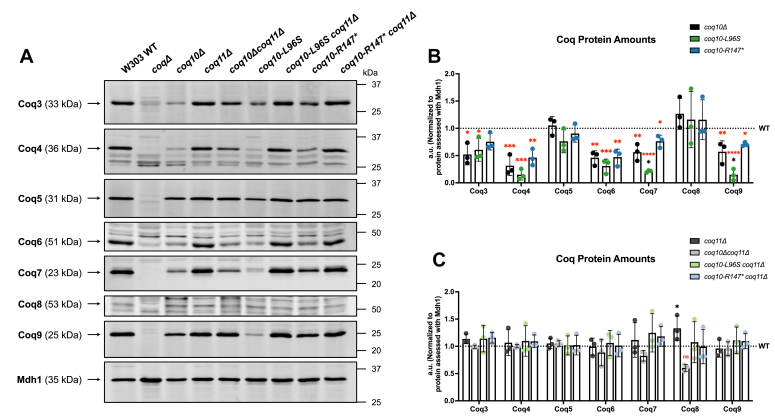
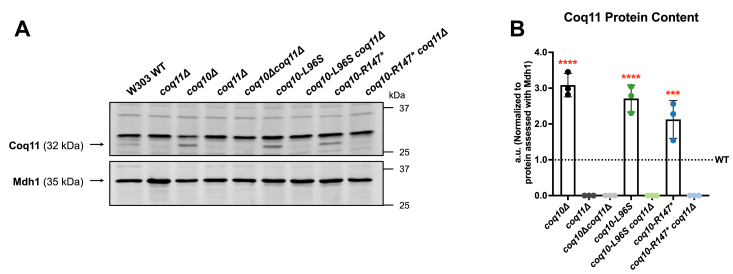
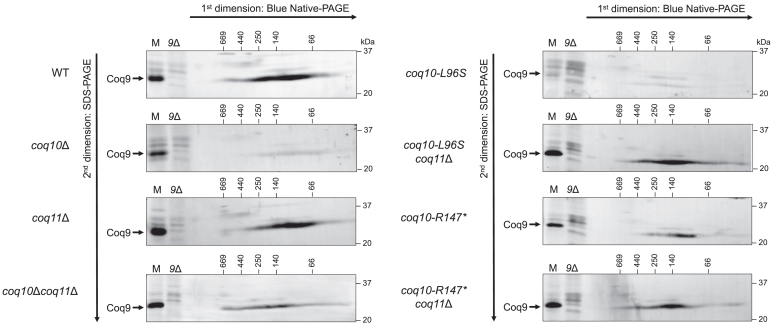
Coenzyme Q (CoQ) is a redox-active lipid molecule that acts as an electron carrier in the mitochondrial electron transport chain. In Saccharomyces cerevisiae, CoQ is synthesized in the mitochondrial matrix by a multisubunit protein-lipid complex termed the CoQ synthome, the spatial positioning of which is coordinated by the endoplasmic reticulum-mitochondria encounter structure (ERMES). The MDM12 gene encoding the cytosolic subunit of ERMES is coexpressed with COQ10, which encodes the putative CoQ chaperone Coq10, via a shared bidirectional promoter. Deletion of COQ10 results in respiratory deficiency, impaired CoQ biosynthesis, and reduced spatial coordination between ERMES and the CoQ synthome. While Coq10 protein content is maintained upon deletion of MDM12, we show that deletion of COQ10 by replacement with a HIS3 marker results in diminished Mdm12 protein content. Since deletion of individual ERMES subunits prevents ERMES formation, we asked whether some or all of the phenotypes associated with COQ10 deletion result from ERMES dysfunction. To identify the phenotypes resulting solely due to the loss of Coq10, we constructed strains expressing a functionally impaired (coq10-L96S) or truncated (coq10-R147∗) Coq10 isoform using CRISPR-Cas9. We show that both coq10 mutants preserve Mdm12 protein content and exhibit impaired respiratory capacity like the coq10Δ mutant, indicating that Coq10's function is vital for respiration regardless of ERMES integrity. Moreover, the maintenance of CoQ synthome stability and efficient CoQ biosynthesis observed for the coq10-R147∗ mutant suggests these deleterious phenotypes in the coq10Δ mutant result from ERMES disruption. Overall, this study clarifies the role of Coq10 in modulating CoQ biosynthesis.

Keywords: CoQ synthome; Coq10; Mdm12; START domain; Saccharomyces cerevisiae; coenzyme Q; endoplasmic reticulum-mitochondria encounter structure; lipid; mitochondrial metabolism; ubiquinone.


Conflict of interest statement

Conflict of interest The authors declare that they have no conflicts of interest with the contents of this article.

Figures

Figure 1
Figure 1
CoQ biosynthesis in yeast requires the CoQ synthome to assemble adjacent to ERMES contact sites.A, the proposed CoQ biosynthetic pathway in Saccharomyces cerevisiae. B, schematic depicting the CoQ synthome positioned adjacent to the ERMES complex. CoQ synthome members are represented in purple and ERMES components are highlighted in turquoise. Coq1, Coq2, and Coq10 (gray) are not members of the CoQ synthome but are still required to observe efficient CoQ6 biosynthesis. This image was generated using BioRender.com. CoQ, coenzyme Q; ERMES, endoplasmic reticulum-mitochondria encounter structure.
Figure 2
Figure 2
The Mdm12 and Mmm1 polypeptides are depleted in yeast coq10Δ mutants.A, aliquots of crude mitochondria (25 μg) from WT, coq10Δ, coq11Δ, and coq10Δcoq11Δ yeast strains were subjected to 10% Tris-glycine SDS-PAGE. Immunoblotting was performed with antisera against the indicated ERMES subunits (Mmm1, Mdm10, and Mdm12), and yeast harboring the corresponding deletions were used as negative controls (ERMESΔ). Malate dehydrogenase (Mdh1) was used as a loading control. Data are representative of three biological replicates. BD, ImageJ was used to quantify triplicate band intensities of select ERMES subunits. Band intensities were normalized to Mdh1 and plotted as percentage of the WT control. The data depict the mean ± SD of three biological replicates. The statistical significance compared with WT is represented by the red asterisks; ∗, p < 0.05 and ∗∗∗∗, p < 0.0001. ERMES, endoplasmic reticulum-mitochondria encounter structure.
Figure 3
Figure 3
Structural prediction of Saccharomyces cerevisiae Coq10 and multiple sequence alignment with human COQ10 orthologs highlight residues targeted for mutagenesis.A, multiple sequence alignment of S. cerevisiae Coq10 (residues 31–207) with the Coq10-L96S and Coq10-R147∗ mutant polypeptides constructed in this study and the human homologs COQ10A (residues 73–244)/COQ10B (residues 64–235). The yeast Coq10 polypeptide and orthologous human sequences were obtained from Universal Protein Knowledgebase (UniProtKB). The multiple sequence alignment was constructed using the ClustalW package of Clustal Omega (59) and visualized in JalView2 (60). Conservation of each residue is indicated by degree of shading, which represents 80%, 60% and 40% percent sequence identity from darkest to lightest shade, respectively. Residues targeted for mutagenesis in this study are indicated with an inverted triangle, and asterisks indicate residues deemed critical for ligand binding in previous studies (11). B, location of the Coq10 residues targeted for mutagenesis by CRISPR-Cas9 (shown in green) within the context of the COQ10 ORF (top) and the AlphaFold predicted structure for S. cerevisiae Coq10 (bottom, AF-Q08058-F1). The region shown in gray represents the truncation that results from introducing the coq10-R147∗/N149∗ double mutation. C, schematic depicting the head-to-head positioning of COQ10 (purple) and MDM12 (gray) within the context of S. cerevisiae chromosome XV (green). Notably, these two genes are separated by only 173 bps, suggesting deletion of one gene could impact the expression of the other, and vice versa.
Figure 4
Figure 4
Mdm12 and Mmm1 protein content is preserved in strains expressing either the Coq10-L96S or Coq10-R147∗ mutant polypeptide.A, aliquots of crude mitochondria (25 μg) from the indicated yeast strains were subjected to 10% Tris-glycine SDS-PAGE. Immunoblotting was performed with antisera against the indicated ERMES subunits (Mmm1, Mdm10, and Mdm12), and mitochondria from yeast harboring the corresponding deletions were used as negative controls (ERMESΔ). Malate dehydrogenase (Mdh1) was used as a loading control. Data are representative of three biological replicates. BD, ImageJ was used to quantify triplicate band intensities of the indicated ERMES proteins. Band intensities were normalized to Mdh1 and plotted as percentage of the WT control. The data depict mean ± SD of three biological replicates, and the statistical significance compared with WT is represented by the red asterisks ∗, p < 0.05 in panel B, or by the stated p value in D. E, 12.5 μg of crude mitochondria were separated on 12% Tris-glycine SDS-PAGE and immunoblotting was performed using Coq10 antisera. An aliquot of mitochondria from the coq10Δ yeast was used as a negative control. F, ImageJ was used to quantify triplicate band intensities for the Coq10 polypeptide. Band intensities were normalized to Mdh1 and plotted as percentage of the WT control. The data depict the mean ± SD of three biological replicates. The statistical significance compared with WT is represented by the red asterisks; ∗∗∗∗, p < 0.0001. ERMES, endoplasmic reticulum-mitochondria encounter structure.
Figure 5
Figure 5
Insertion of the HIS3 marker at the COQ10 locus causes aberrant transcription into the neighboring MDM12 gene. The bar graphs show normalized read counts for A, COQ10 and B, MDM12 mRNAs based on reads obtained with Oxford Nanopore sequencing using a complementary DNA approach for three replicates per strain (see Experimental procedures). DESeq2 was used to quantify changes in gene expression of the different strains and for normalizing counts to library size. The p-adjusted is used to indicate significance. The data depict the mean ± SD of three biological replicates, and the statistical significance of COQ10 read counts compared with WT is represented by the red asterisks, ∗∗, p < 0.01; and ∗∗∗∗, p < 0.0001. No significant differences were observed for the MDM12 read counts. C, nanopore sequencing reads detected in the COQ10 and MDM12 regions for the indicated strains. Each sequencing read is represented by a horizontal gray line. No reads were detected for the COQ10 ORF in the coq10Δ mutant because of the replacement of the COQ10 ORF by the HIS3 marker. Since the reads were aligned to the WT genome, reads corresponding to the HIS3 gene are not shown. The HIS3 marker is oriented in a way that positions the HIS3 promoter adjacent to the 3′ UTR of the deleted COQ10 ORF.
Figure 6
Figure 6
The coq10-L96S and coq10-R147∗ mutants display impaired respiratory growth similar to the coq10Δ mutant that can be restored by deletion of COQ11. Overnight cultures of the indicated yeast strains were diluted to an A600 = 0.2, and 2 μl of 5-fold serial dilutions were spotted onto fermentable (YPDextrose, YPD) or respiratory (YPGlycerol, YPG) medium. Plates were incubated at 30 °C for 2 or 3 days prior to imaging. Data are representative of three biological replicates.
Figure 7
Figure 7
The coq10-R147∗ mutant retains the ability to efficiently synthesize CoQ6. Triplicates of yeast cultured in 25 ml YPGal were labeled at an A600 ∼0.6 with 8 μg/ml 13C6-pABA or ethanol as a vehicle control. Fifteen milliliters of each culture were harvested after 5 h, lipid extracted, and analyzed by LC-MS/MS. A, unlabeled 12C-CoQ6; B, labeled 13C6-CoQ6; C, total amount of CoQ6 determined from the sum of 12C-CoQ6 (white) and 13C6-CoQ6 (red). The data depict the mean ± SD. The statistical significance as compared with the coq10Δ mutant is represented by the black asterisks; ∗, p < 0.05; ∗∗∗, p < 0.001; and ∗∗∗∗, p < 0.0001. CoQ, coenzyme Q; pABA, para-aminobenzoic acid; YPGal, yeast extract-peptone-galactose.
Figure 8
Figure 8
The coq10-L96S mutant has impaired CoQ6biosynthetic efficiency in comparison to coq10Δ. Triplicate of 25 ml cultures in YPGal were labeled at an A600 ∼0.6 with 8 μg/ml 13C6-pABA or ethanol. 15 ml of each culture were harvested after 5 h, lipid extracted, and analyzed by LC-MS/MS. A, 12C-HAB (white) and 13C6-HAB (red) and B, 12C-DMQ6 (white) and 13C6-DMQ6 (red) were measured from whole-cell lipid extracts of the indicated yeast strains. Total HAB and DMQ6 were determined from the sum of the respective labeled and unlabeled analytes. The data show mean ± SD. The statistical significance as compared to the coq10Δ mutant is represented by the black asterisks; ∗, p < 0.05; ∗∗, p < 0.01; ∗∗∗, p < 0.001; and ∗∗∗∗, p < 0.0001. CoQ, coenzyme Q; DMQ, demethoxy-Q; HAB, hexaprenylaminobenzoic acid; pABA, para-aminobenzoic acid; YPGal, yeast extract-peptone-galactose.
Figure 9
Figure 9
Decreased abundance of several Coq polypeptides in the coq10-L96S and coq10-R147∗ mutants can be rescued by deletion of COQ11.A, aliquots of crude mitochondria (12.5 μg) from the indicated yeast strains were subjected to 10% or 12% Tris-glycine SDS-PAGE. Crude mitochondria from coq3Δ-coq9Δ mutants were included as negative controls for Western blotting using antisera against each of the Coq polypeptides. Mitochondrial malate dehydrogenase (Mdh1) was included as a loading control. Data are representative of three biological replicates. B, ImageJ was used to quantify triplicate band intensities for each of the Coq polypeptides. Band intensities were normalized to Mdh1 and plotted as percentage of the WT control. The data depict the mean ± SD of three biological replicates. The statistical significance as compared with WT (red asterisks) or the coq10Δ mutant (black asterisks) are represented by, ∗, p < 0.05; ∗∗, p < 0.01; ∗∗∗, p < 0.001; and ∗∗∗∗, p < 0.0001. C, blots were quantified as in B. The data depict the mean ± SD of three biological replicates, and the statistical significance as compared with WT (red asterisks) or the coq10Δcoq11Δ mutant (black asterisks) are represented by ns, no significance; and ∗, p < 0.05.
Figure 10
Figure 10
Relative Coq11 protein abundance is significantly increased in strains harboring coq10 mutations.A, aliquots of crude mitochondria (12.5 μg) from the indicated yeast strains were subjected to 10% Tris-glycine SDS-PAGE. An aliquot of crude mitochondria from the coq11Δ mutant was included as a negative control for Western blotting against the Coq11 polypeptide. Mitochondrial malate dehydrogenase (Mdh1) was included as a loading control. The Mdh1 blot is replicated from Fig. 9A as the same sets of samples were used across all biological replicates when quantifying protein content for the individual Coq polypeptides. Data are representative of three biological replicates. B, ImageJ was used to quantify triplicate band intensities corresponding to Coq11. Band intensities were normalized to Mdh1 and plotted as percentage of the WT control. The data depict the mean ± SD of three biological replicates. The statistical significance compared with WT is represented by the red asterisks; ∗, p < 0.05; ∗∗, p < 0.01; ∗∗∗, p < 0.001.
Figure 11
Figure 11
The coq10-R147∗ mutant maintains a stable CoQ synthome similar to the WT control. Aliquots (75 μg) of crude mitochondria isolated from WT, coq10Δ, coq11Δ, coq10Δcoq11Δ, coq10-L96S, coq10-L96S coq11Δ, coq10-R147∗, and coq10-R147∗ coq11Δ yeast were solubilized with digitonin and separated by 2D BN/SDS-PAGE. Proteins were transferred to polyvinylidene fluoride membranes, and the CoQ synthome was visualized using antisera against Coq9. Aliquots (25 μg) of intact crude mitochondria from each strain (M) and coq9Δ (9Δ) yeast were included as a loading control and negative control, respectively. BN, blue native; CoQ, coenzyme Q.

Similar articles

References

    1. Banerjee R., Purhonen J., Kallijarvi J. The mitochondrial coenzyme Q junction and complex III: biochemistry and pathophysiology. FEBS J. 2022;289:6936–6958. - PubMed
    1. Guerra R.M., Pagliarini D.J. Coenzyme Q biochemistry and biosynthesis. Trends Biochem. Sci. 2023;48:463–476. - PMC - PubMed
    1. Okada K., Suzuki K., Kamiya Y., Zhu X., Fujisaki S., Nishimura Y., et al. Polyprenyl diphosphate synthase essentially defines the length of the side chain of ubiquinone. Biochim. Biophys. Acta. 1996;1302:217–223. - PubMed
    1. Frei B., Kim M.C., Ames B.N. Ubiquinol-10 is an effective lipid-soluble antioxidant at physiological concentrations. Proc. Natl. Acad. Sci. U. S. A. 1990;87:4879–4883. - PMC - PubMed
    1. Awad A.M., Bradley M.C., Fernandez-Del-Rio L., Nag A., Tsui H.S., Clarke C.F. Coenzyme Q10 deficiencies: pathways in yeast and humans. Essays Biochem. 2018;62:361–376. - PMC - PubMed

MeSH terms