. 2024 Feb 29:12:e16974.
doi: 10.7717/peerj.16974. eCollection 2024.

A Cellular Potts Model of the interplay of synchronization and aggregation

Affiliations

A Cellular Potts Model of the interplay of synchronization and aggregation

Rose Una et al. PeerJ. .

Abstract

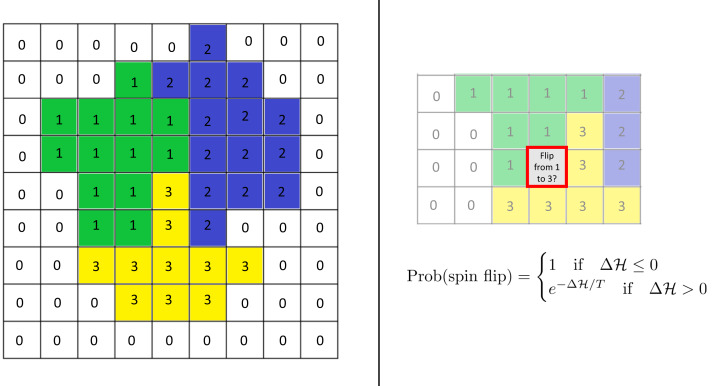
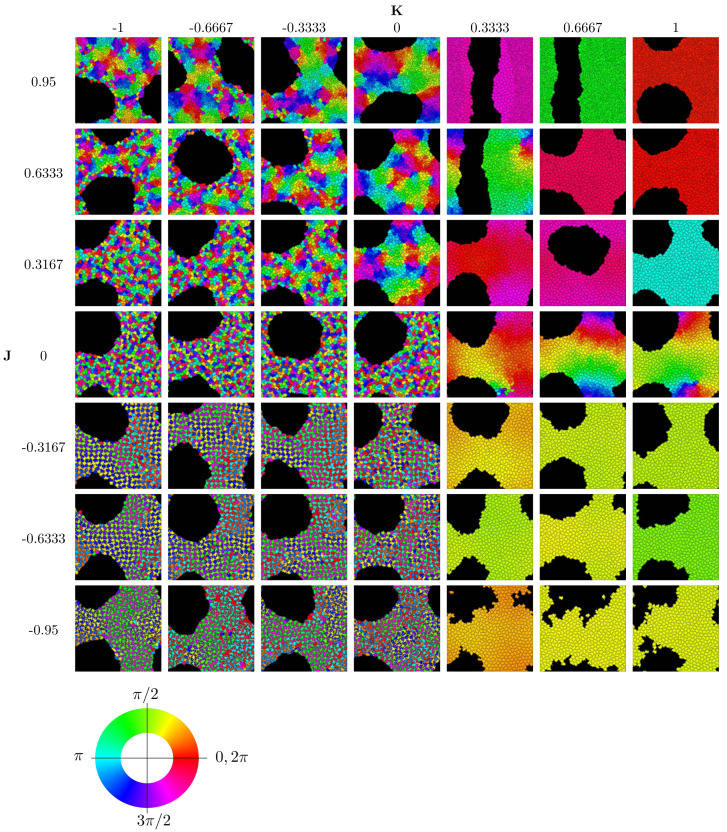
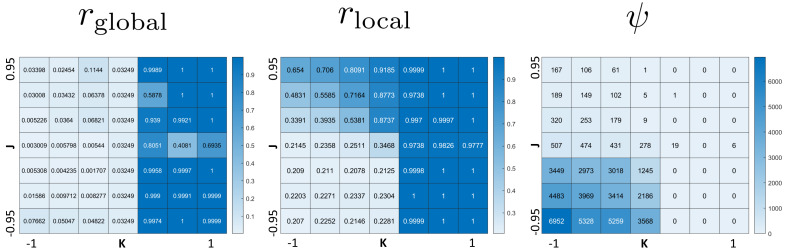
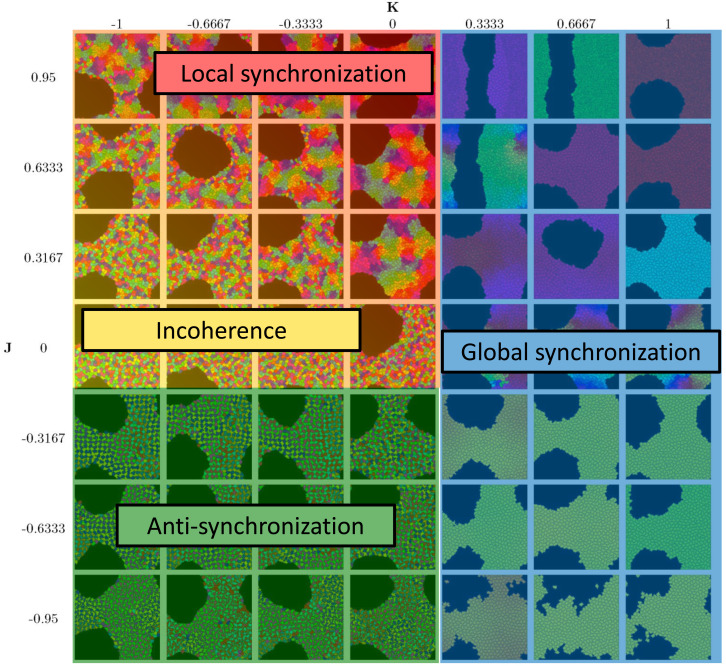
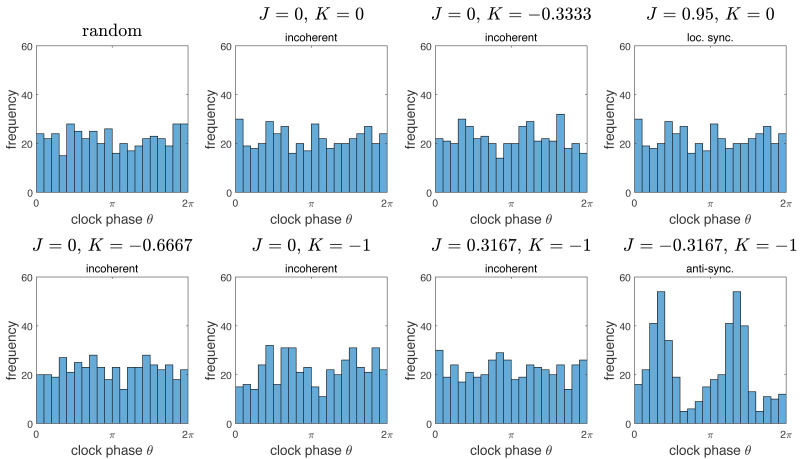
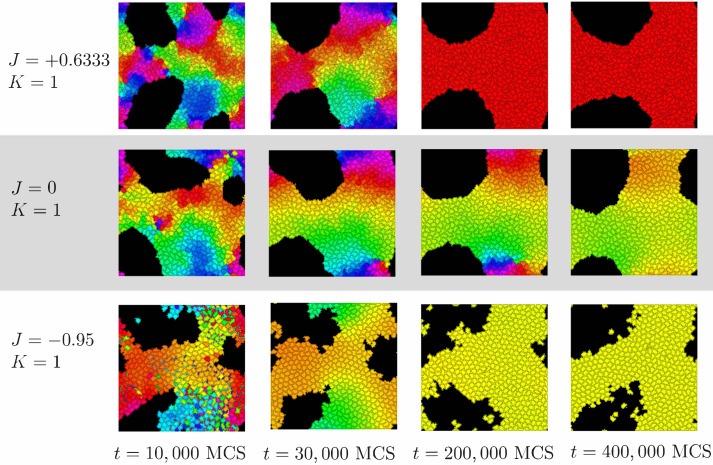
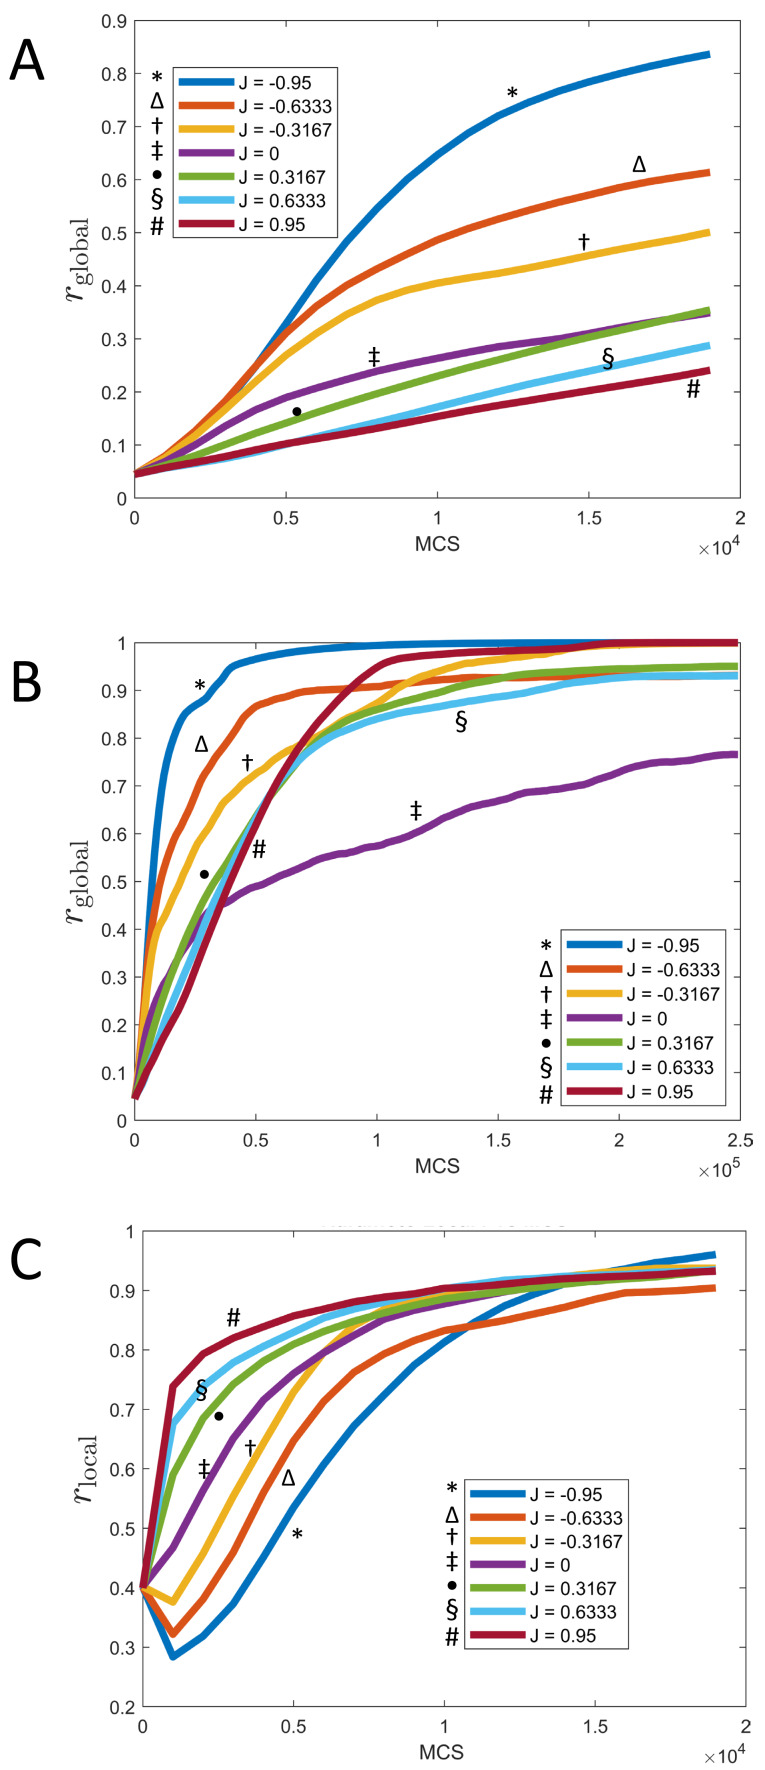
We investigate the behavior of systems of cells with intracellular molecular oscillators ("clocks") where cell-cell adhesion is mediated by differences in clock phase between neighbors. This is motivated by phenomena in developmental biology and in aggregative multicellularity of unicellular organisms. In such systems, aggregation co-occurs with clock synchronization. To account for the effects of spatially extended cells, we use the Cellular Potts Model (CPM), a lattice agent-based model. We find four distinct possible phases: global synchronization, local synchronization, incoherence, and anti-synchronization (checkerboard patterns). We characterize these phases via order parameters. In the case of global synchrony, the speed of synchronization depends on the adhesive effects of the clocks. Synchronization happens fastest when cells in opposite phases adhere the strongest ("opposites attract"). When cells of the same clock phase adhere the strongest ("like attracts like"), synchronization is slower. Surprisingly, the slowest synchronization happens in the diffusive mixing case, where cell-cell adhesion is independent of clock phase. We briefly discuss potential applications of the model, such as pattern formation in the auditory sensory epithelium.

Keywords: Aggregation; Biological clocks; Cellular Potts Model; Mathematical modeling; Synchronization.


Conflict of interest statement

The authors declare there are no competing interests.

Figures

Figure 1
Figure 1. Schematics of the cellular potts model.
Left: Cells are modeled as sets of lattice sites. We picture three cells with indices (“spins”) 1–3. The index 0 denotes the extracellulcar matrix (medium). Each cell has a clock whose current value is represented by the color of the cell. Each configuration of the lattice has a Hamiltonian (energy) H, which encodes various biological phenomena such as adhesion and elasticity. Right: Time evolution is modeled via so-called “spin flips”. A lattice site is chosen at random and a change of its index to that of a neighboring cell is proposed. This change is accepted with the displayed probability which depends on the change ΔH in the Hamiltonian it causes. Here T is a given constant, the “temperature.” See the text for more details.
Figure 2
Figure 2. Parameter sweep of the model showing the state after 250,000 MCS.
Cells are colored according to their clock phase. (Specifically, the colors show the clock phase difference relative to a standard clock moving at constant clock speed ω starting at 0.) Values shown are J ∈ { − 0.95,  − 0.6333,  − 0.3167, 0, 0.3167, 0.6333, 0.95} and K ∈ { − 1,  − 0.6667,  − 0.3333, 0, 0.3333, 0.6667, 1}. Simulation runs were each of N = 445 cells and identical initial conditions (random distribution of clock phases).
Figure 3
Figure 3. Heat maps of the three order parameters (rglobal, rlocal, checkerboard parameter ψ).
Note the jump-like transitions along the lines K = 0 for rglobal, as well as J = 0 and K = 0 for ψ. There is a similar sharp sharp transition of rlocal along K = 0 for J < 0 and a curve in the quadrant J > 0, K ≤ 0. This separates the parameter space into four phases: global synchronization (rglobal ≈ 1); local synchronization (rlocal ≈ 1, rglobal = 0); antisynchronization (checkerboard pattern) (large ψ); and incoherence (all order parameters “small”, see Fig. 4).
Figure 4
Figure 4. Diagram of the four phases of the model.
See Fig. 3 for order parameters.
Figure 5
Figure 5. Histograms of distributions of clock phases for some of the simulations from Fig. 2.
Each of the N = 445 cells gives one data point in the interval [0, 2π). We used 20 bins. Here “random” denotes a random sample obtained by choosing n = 445 random numbers in [0, 2π) with uniform probability distribution. Note that the resulting distributions for the “incoherent” phase data is essentially indistinguishable from the random distribution. Interestingly, the same is true for the example of the “locally synchronized” phase, but not the “anti-synchronized” (or checkerboard) phase, which is bimodal.
Figure 6
Figure 6. Progress of synchronization for K = 1 and different values of J.
Cells are colored by the clock phase difference relative to a standard clock moving at constant clock speed ω as in Fig. 2.
Figure 7
Figure 7. Synchronization of cells over time for different values of J and fixed K = 1.
(A) Parameter rglobal as a function of time (MCS) up to t = 20, 000 MCS, covering the initial phase of synchronization. (B) Parameter rglobal as a function of time (MCS) up to t = 250, 000 MCS, covering the long term behavior. (C) Parameter rlocal as a function of time (MCS) up to t = 20, 000 MCS, covering the initial phase of synchronization. (All graphs are based on n = 10 runs for each curve.).

Similar articles

References

    1. Alber MS, Jiang Y, Kiskowski MA. Lattice gas cellular automation model for rippling and aggregation in myxobacteria. Physica D: Nonlinear Phenomena. 2004;191(3):343–358. doi: 10.1016/j.physd.2003.11.012. - DOI
    1. Arias Del Angel JA, Nanjundiah V, Benítez M, Newman SA. Interplay of mesoscale physics and agent-like behaviors in the parallel evolution of aggregative multicellularity. EvoDevo. 2020;11(1):1–18. doi: 10.1186/s13227-020-0147-0. - DOI - PMC - PubMed
    1. Armstrong PB. Light and electron microscope studies of cell sorting in combinations of chick embryo neural retina and retinal pigment epithelium. Wilhelm Roux’ Archiv für Entwicklungsmechanik Der Organismen. 1971;168(2):125–141. doi: 10.1007/BF00581804. - DOI - PubMed
    1. Barciś A, Bettstetter C. Sandsbots: robots that sync and swarm. IEEE Access. 2020;8:218752–218764. doi: 10.1109/ACCESS.2020.3041393. - DOI
    1. Bhat R, Glimm T, Linde-Medina M, Cui C, Newman SA. Synchronization of Hes1 oscillations coordinates and refines condensation formation and patterning of the avian limb skeleton. Mechanisms of Development. 2019;156:41–54. doi: 10.1016/j.mod.2019.03.001. - DOI - PubMed

Grants and funding

Tilmann Glimm was supported by the John Templeton Foundation (#62220). The opinions expressed in this paper are those of the authors and not those of the John Templeton Foundation. Rose Una was supported by a Jarvis Memorial Summer Research Stipend from Western Washington University. The funders had no role in study design, data collection and analysis, decision to publish, or preparation of the manuscript.