. 2024 Jan 23;22(1):e3002454.
doi: 10.1371/journal.pbio.3002454. eCollection 2024 Jan.

Killer prey: Ecology reverses bacterial predation

Affiliations

Killer prey: Ecology reverses bacterial predation

Marie Vasse et al. PLoS Biol. .

Abstract

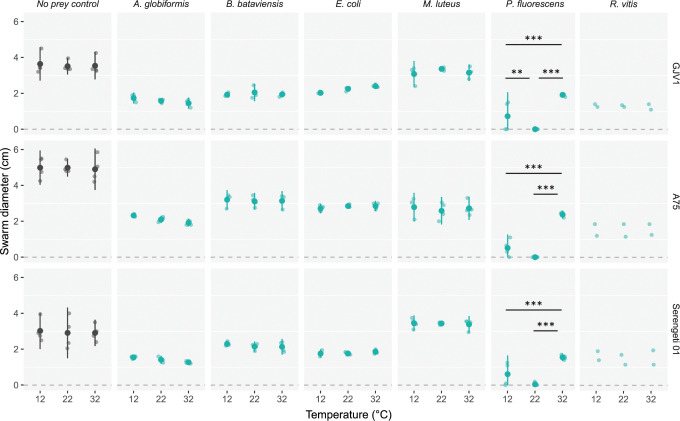
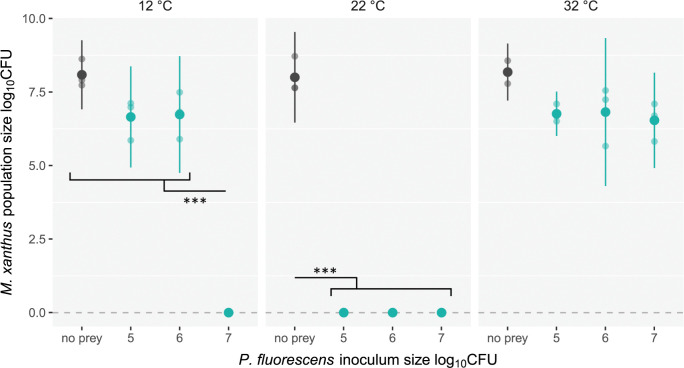
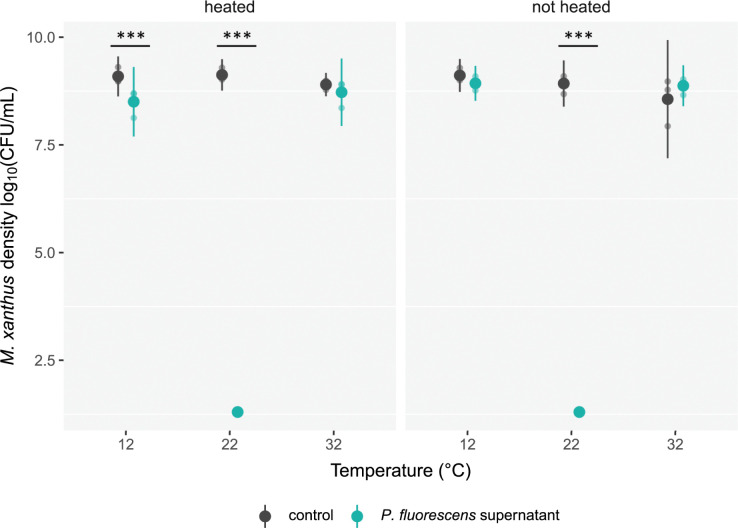
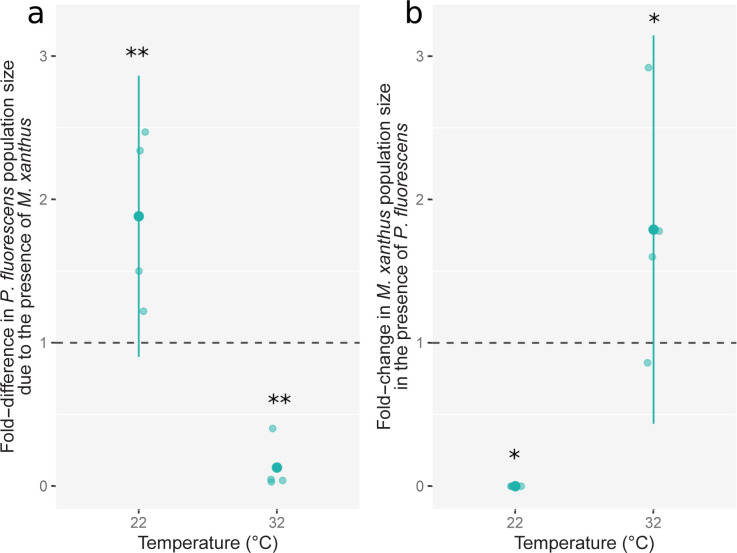
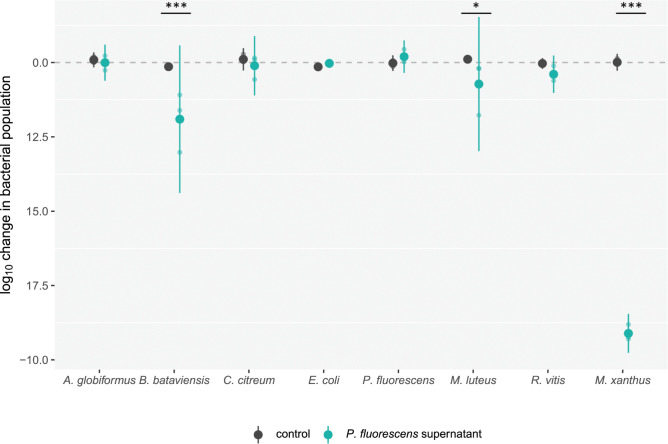
Ecological variation influences the character of many biotic interactions, but examples of predator-prey reversal mediated by abiotic context are few. We show that the temperature at which prey grow before interacting with a bacterial predator can determine the very direction of predation, reversing predator and prey identities. While Pseudomonas fluorescens reared at 32°C was extensively killed by the generalist predator Myxococcus xanthus, P. fluorescens reared at 22°C became the predator, slaughtering M. xanthus to extinction and growing on its remains. Beyond M. xanthus, diffusible molecules in P. fluorescens supernatant also killed 2 other phylogenetically distant species among several examined. Our results suggest that the sign of lethal microbial antagonisms may often change across abiotic gradients in natural microbial communities, with important ecological and evolutionary implications. They also suggest that a larger proportion of microbial warfare results in predation-the killing and consumption of organisms-than is generally recognized.


Conflict of interest statement

The authors have declared that no competing interests exist.

Figures

Fig 1
Fig 1. M. xanthus swarming through P. fluorescens lawns depends on the temperature of P. fluorescens growth prior to predator–prey interaction.
Swarm diameters of 3 M. xanthus genotypes (rows) after 7 days on M9cas agar bearing either a lawn of one of several prey species (green dots) or no prey (black dots). Prey lawns were incubated at 12, 22, or 32°C for 22 hours and then brought to room temperature for 2 hours before M. xanthus was added. Small dots are biological replicates (n = 3 except for R. vitis for which n = 2), and error bars represent 95% confidence intervals about the means (big dots). Significant differences between average diameters of swarms on prey grown at different temperatures are shown; ** p < 0.01, *** p < 0.001 (Tukey-adjusted contrasts). The dataset for this figure and the R script used to analyze it and make the figure are available on Zenodo (10.5281/zenodo.10214013).
Fig 2
Fig 2. P. fluorescens grown at 22°C from any inoculum size or at 12°C from high inoculum size exterminates M. xanthus.
M. xanthus strain DK3470 population size 7 days after inoculation onto P. fluorescens lawns that had grown overnight from one of 3 inoculum population sizes (green dots) at one of 3 temperatures prior to addition of M. xanthus. Black dots show corresponding data for controls lacking P. fluorescens. Means of log10-transformed CFU + 1 values and 95% confidence intervals are shown. Lighter dots are biological replicates (n = 3). Significant differences between M. xanthus population sizes within prey-growth temperature treatments are shown; *** p < 0.001 (Tukey-adjusted contrasts). The dataset for this figure and the R script used to analyze it and make the figure are available on Zenodo (10.5281/zenodo.10214013).
Fig 3
Fig 3. P. fluorescens reared at 22°C kills M. xanthus with a diffusive, nonproteinaceous secretion.
M. xanthus density after 6 hours of incubation in the supernatant of buffer suspensions of P. fluorescens cultures grown at 12, 22, or 32°C for 24 hours (green dots) or in control buffer (black dots) and subsequent exposure to either 95°C or room temperature for 45 minutes (left and right panels, respectively). Means of log10-transformed (CFU + 1)/ml values and 95% confidence intervals are shown. Lighter dots are biological replicates (n = 3). Significant differences between predator densities after incubation in supernatant vs. buffer per prey-growth-temperature treatment are shown; *** p < 0.001 (Tukey-adjusted contrasts). The dataset for this figure and the R script used to analyze it and make the figure are available on Zenodo (10.5281/zenodo.10214013).
Fig 4
Fig 4. Predation reversal: P. fluorescens grown at 22°C preys upon M. xanthus (a) but P. fluorescens grown at 32°C is preyed upon by M. xanthus (b).
Panel (a) shows fold-differences in P. fluorescens populations to which M. xanthus was added relative to control populations to which only liquid buffer was added, when P. fluorescens was previously grown at either 22°C or 32°C prior interaction. Population sizes were estimated 24 hours after addition of M. xanthus or buffer. Panel (b) shows fold-change in M. xanthus strain DK3470 population size over 24 hours in the presence P. fluorescens previously grown at either 22°C or 32°C. Lighter dots are biological replicates (n = 4). Means of ratios of CFU values and 95% confidence intervals are shown. Asterisks indicate significant differences from 1: * p < 0.05 and ** p < 0.01 (post hoc two-sided t tests against 1 with Benjamini–Hochberg correction for multiple testing). The datasets for this figure and the R script used to analyze them and make the figure are available on Zenodo (10.5281/zenodo.10214013).
Fig 5
Fig 5. Secretions of 22°C-reared P. fluorescens harm a minority of diverse tested species.
Change in densities of diverse bacterial species (log10) after 6 hours of incubation in supernatant from a buffer suspension of P. fluorescens grown at 22°C (green dots) or in a control buffer (black dots). Mean values and 95% confidence intervals are shown. Lighter dots are biological replicates (n = 3). Significant differences between supernatant and control treatments are shown; *** p < 0.001 and * p < 0.05 (two-sided t tests with Benjamini–Hochberg correction). The dataset for this figure and the R script used to analyze it and make the figure are available on Zenodo (10.5281/zenodo.10214013).

Similar articles

Cited by

References

    1. Chamberlain SA, Bronstein JL, Rudgers JA. How context dependent are species interactions? Ecol Lett. 2014. Jul;17(7):881–890. doi: 10.1111/ele.12279 - DOI - PubMed
    1. Dunson WA, Travis J. The Role of Abiotic Factors in Community Organization. Am Nat. 1991;138(5):1067–1091.
    1. Domenici P, Claireaux G, McKenzie DJ. Environmental constraints upon locomotion and predator–prey interactions in aquatic organisms: an introduction. Philos Trans R Soc Lond B Biol Sci. 2007. May;362(1487):1929–1936. doi: 10.1098/rstb.2007.2078 - DOI - PMC - PubMed
    1. Grigaltchik VS, Ward AJW, Seebacher F. Thermal acclimation of interactions: differential responses to temperature change alter predator–prey relationship. Proc R Soc B Biol Sci. 2012. Aug;279(1744):4058–4064. doi: 10.1098/rspb.2012.1277 - DOI - PMC - PubMed
    1. Merilaita S, Lyytinen A, Mappes J. Selection for cryptic coloration in a visually heterogeneous habitat. Proc R Soc Lond Ser B Biol Sci. 2001. Sep 22;268(1479):1925–1929. - PMC - PubMed

Grants and funding

This work was funded by Swiss National Science Foundation (SNSF) grant 310030B_182830 to GJV. The funders had no role in study design, data collection and analysis, decision to publish, or preparation of the manuscript.