. 2023 Aug 23;14(1):5141.
doi: 10.1038/s41467-023-40788-8.

Cell type-specific delivery by modular envelope design

Affiliations

Cell type-specific delivery by modular envelope design

Daniel Strebinger et al. Nat Commun. .

Abstract

The delivery of genetic cargo remains one of the largest obstacles to the successful translation of experimental therapies, in large part due to the absence of targetable delivery vectors. Enveloped delivery modalities use viral envelope proteins, which determine tropism and induce membrane fusion. Here we develop DIRECTED (Delivery to Intended REcipient Cells Through Envelope Design), a modular platform that consists of separate fusion and targeting components. To achieve high modularity and programmable cell type specificity, we develop multiple strategies to recruit or immobilize antibodies on the viral envelope, including a chimeric antibody binding protein and a SNAP-tag enabling the use of antibodies or other proteins as targeting molecules. Moreover, we show that fusogens from multiple viral families are compatible with DIRECTED and that DIRECTED components can target multiple delivery chassis (e.g., lentivirus and MMLV gag) to specific cell types, including primary human T cells in PBMCs and whole blood.


Conflict of interest statement

D.S. and F.Z. are coinventors on a pending patent application (PCT/US22/52871) related to this work filed by the Broad Institute and MIT. M.J.F. reports receiving speaker’s bureau honoraria from Pfizer. F.Z. is a scientific advisor and cofounder of Editas Medicine, Beam Therapeutics, Pairwise Plants, Arbor Biotechnologies, and Aera Therapeutics. F.Z. is a scientific advisor for Octant. The remaining authors declare no competing interests.

Figures

Fig. 1
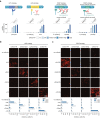
Fig. 1. Development of DIRECTED.
a Schematic of lentiviral vector production and lentivector-mediated delivery to target cells. b Schematic to expand tropism by co-expressing VSV-G and a variant of protein AG (pAG) that can recruit an antibody on virions (left). Transduction efficiency of HEK293FT cells (as a percentage of mCherry+ cells) of lentiviral particles with various ratios of VSV-G and pAG in the presence or absence of αHLA-A2 (right, N = 4 for all conditions, p-values: 0.03042, 0.00162, 0.001386, 0.0001269, 7.39E-05, 0.001728, 0.01287, 1, 1). c Schematic to reduce VSV-G-mediated tropism by mutating residues that interact with low-density lipoprotein receptors (LDL-R) (left). Quantification of titers for VSV-G mutants (middle; N = 18 for WT; 12 for H8A, K47Q, Y209A, R354Q; 6 for H8A&K47Q, H8A&R354Q, K47Q&R354Q, R354Q&Y209A; p-values: 1, 2.25E-07, 3.22E-06, 1.92E-07, 1.36E-06, 5.70E-05, 7.31E-07, 6.03E-07). Transduction efficiency of HEK293FT cells (as a percentage of mCherry+ cells) of lentiviral particles with VSV-G point mutations (right; N = 6 for WT; 4 for H8A, K47Q, Y209A, R354Q; 2 for H8A&K47Q, H8A&R354Q, K47Q&R354Q, R354Q&Y209A; p-values: 2.28E-07, 4.74E-08, 0.016, 5.26E-07, 5.16E-07, 5.22E-07, 5.15E-07, 4.98E-07). d Schematic showing separate fusion and targeting components by combining VSV-G K47Q/R354Q (VSV-Gdm) with pAG (left). Transduction efficiency of HEK293FT wild-type cells or B2M knockout cells as a percentage of mCherry+ cells (right, N = 4 for all conditions) of lentiviral particles with VSV-Gdm and pAG in the presence or absence of αHLA-A2 at different MOI. (p-values: wild-type: 0.0001926, 1.15E-06, 1.54E-06, 0.002304, 1.19E-05, 0.0001458; ΔB2M: 1, 0.258, 0.876, 0.21, 0.822, 0.02598). For panels b, c, and d, a two-sided Welch’s t-test with Bonferroni correction was used. [ns, not significant; * p < 0.05; **p < 0.01; ***p < 0.001; ****p < 0.0001; Data are presented as mean ± standard deviation. Source data are provided as a Source Data file].
Fig. 2
Fig. 2. Antibody-dependent specificity of DIRECTED.
a Titration of αCD3 antibody amount for transduction of Jurkat E6 cells (N = 3 for all conditions). Data was analyzed by an ANOVA followed by a Dunnett’s post-hoc test with a Bonferroni correction. p-values: MOI = 0: 0.525515494, 0.996006008, 0.999997333, 0.999917242, 0.237466884; MOI = 500: 5.38E-09, 0.000421347, 0.024090801, 0.841344411, 0.540949719; MOI = 1000: 1.18E-09, 2.30E-07, 0.012478994, 0.856828212, 0.999999895; MOI = 2000: 3.16E-10, 8.30E-06, 0.038954163, 0.96165626, 0.999993745. b Transduction efficiency (as a percentage of mCherry+ cells) of Jurkat E6 cells (CD3+) and K562 cells (HLA-A2+) in a co-culture with either αCD3-DIRECTED (N = 3 for each condition), αHLA-A2-DIRECTED (N = 3 for each condition), or non-targeting (no antibody, N = 2 for each condition) lentiviral particles. A two-sided Welch’s t-test with Bonferroni correction was used. p-values: aCD3-DIRECTED: 1.95E-05, 8.61E-09, 1.58E-05, 5.52E-05, 4.80E-06, 0.0001883, 6.69E-06; aHLA-A2-DIRECTED: 3.78E-09, 1.32E-06, 2.70E-07, 8.47E-06, 2.81E-07, 2.58E-05, 0.003248; non-targeting: 0.1386, 0.05691, 0.0973, 0.1813, 0.091, 1, 1. [ns, not significant; *p < 0.05; **p < 0.01; ***p < 0.001; ****p < 0.0001; Data are presented as mean ± standard deviation. Source data are provided as a Source Data file].
Fig. 3
Fig. 3. Targeting strategies and specificity of DIRECTED.
a (Top) Schematic representation of antibody-tethering strategies and (bottom) relative transduction efficiency of Jurkat+surface-HA cells sorted into four bins of different expression levels (low, medium low, medium high, high) or WT cells (no) using DIRECTED lentiviral particles with the scFv strategy (left), the pAG strategy (middle), or the SNAP strategy (right, with excess antibody or after removal of excess antibody) targeting surface-HA (N = 4 for each condition). b (Top) Representative microscopy images of HEK293FT cells engineered to express different synthetic surface receptors (surface-HA, surface-Spot, surface-Strep, and surface-V5) after delivery of an H2B-mCherry transgene using pAG-DIRECTED lentiviral particles with the indicated targeting antibodies (no antibody, αHA, αSpot, αStrep, and αV5). (Bottom) Transduction efficiency (as a percentage of mCherry+ cells) for the synthetic cell lines with the indicated targeting antibodies at different MOI (N = 4 for each condition). c (Top) Representative microscopy images of the same cell lines as in (b), using SNAP-DIRECTED lentiviral particles in the presence of an excess of the indicated BG-labeled targeting antibodies (no antibody, αHA-BG, αSpot-BG, αStrep-BG, and αV5-BG) at different MOI. (Bottom) Transduction efficiency (as a percentage of mCherry+ cells) for the synthetic cell lines with an excess of the indicated targeting antibodies at different MOI (N = 4 for each condition). Data are presented as the mean with the error bars indicating the sample standard deviation. Source data are provided as a Source Data file. For panel (a) a two-sided Welch’s t-test with Bonferroni correction was used. p-values sc-Fv strategy 3.52E-06, 0.000116, 0.000242, 0.032; pAG strategy—no antibody 0.368, 0.3, 1, 0.472; pAG strategy—αHA 0.0001224, 0.0001236, 0.00026, 0.016; SNAP strategy (excess antibody)—no antibody 0.524, 1, 1, 1; SNAP strategy (excess antibody)—αHA-BG 1.55E-05, 1.50E-06, 6.08E-08, 3.77E-07; SNAP strategy (excess antibody removed)—no antibody 1, 0.06, 1, 1; SNAP strategy (excess antibody removed)—αHA-BG 0.000412, 0.000384, 0.068, 1. [ns, not significant; *p < 0.05; **p < 0.01; ***p < 0.001; ****p < 0.0001; scale bar is 100 µm; SecSig secretion signal, TM transmembrane domain].
Fig. 4
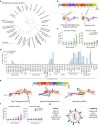
Fig. 4. Exploration of the natural diversity of fusogens and their compatibility with DIRECTED.
a Phylogenetic tree of Rhabdoviral envelope proteins using VSV-G as a seed. b (Top) Domain structure of VSV-G. (Bottom) AlphaFold2 models of VSV-G and Cocal virus G monomers. Cyan: SecSig, secretion signal; Red: DI, lateral domain; orange: DII, trimerization domain; purple: DIII, pleckstrin homology domain; blue: DIV, fusion domain (hydrophobic residues in red); gray: MP, membrane proximal domain; green: TM, transmembrane domain; yellow: CTD, C-terminal domain. c Transduction efficiency (%mCherry+) of WT and ΔB2M HEK293FT cells for pAG-DIRECTED particles using Cocal virus G mutant as the fusogen with an αHLA-A2 antibody at different MOI (N = 4 for each condition). d Transduction efficiency of HEK293FT cells (as percentage of mCherry+ cells) for a library of pAG-DIRECTED lentiviral particles using the indicated fusogens in the absence of an antibody or with an αHLA-A2 antibody. BoVBornaviridae, CoVCoronaviridae, FiVFiloviridae, OrmyVOrthomyxoviridae, PamyVParamyxoviridae, m168—engineered sindbis envelope, no env—no envelope, BC only—Barcode vector only, empty—no transfer genome transfected. e (Top) Domain architecture of GP64 and (bottom) AlphaFold2 models for monomers of Dhori thogotovirus GP, Quaranfil quaranjavirus G, and baculovirus GP64 (hydrophobic residues in yellow). Cyan: SecSig; magenta: DIII; orange: DII; red: DI, fusion domain; blue: DIV; green: DV; gray: MP; cyan: TM; yellow: CTD. f Transduction efficiency (%mCherry+) of WT and ΔB2M HEK293FT cells for pAG-DIRECTED particles using GP64 as the fusogen with an αHLA-A2 antibody at different MOI (N = 4 for each condition). g Schematic showing the modular features of DIRECTED particles, highlighting that the fusion and targeting components can be combined in a plug-and-play manner. For panels (c), and (f), a two-sided Welch’s t-test with Bonferroni correction was used. p-values in (c), HEK293FT WT 1, 0.315, 0.05142, 0.000948, 9.36E-06, 2.35E-05; HEK293FT ΔB2M 1, 1, 1, 1, 1, 0.69; in (f), HEK293FT WT 0.004272, 0.001794, 0.00159, 0.00015, 0.000411, 1.99E-06; HEK293FT ΔB2M 0.4314, 1, 1, 1, 0.513, 0.002772. [ns, not significant; *p < 0.05; **p < 0.01; ***p < 0.001; ****p < 0.0001] Data are presented as mean ± standard deviation. Source data are provided as a Source Data file.
Fig. 5
Fig. 5. DIRECTED is compatible with modalities that allow protein or RNP delivery.
a (Left) Schematic showing the architecture of αCD5-targeting SNAP-DIRECTED-CreVLPs that package Cre protein. (Right) Efficiency of Cre protein delivery as determined by percentage of GFP+ cells upon application of αCD5-targeting SNAP-DIRECTED-CreVLPs without the removal of excess antibody on Jurkat E6 Cre reporter cells at different doses (N = 2 for each condition, p-values: 0.328, 0.21375, 0.189, 0.196714286, 0.11088, 0.069075, 0.0435, 0.0435, 0.0435). b (Left) Schematic showing the elements of Cas9-RNP delivering pAG-DIRECTED particles. (Right) Loss of B2M protein expression on Jurkat E6 cells upon delivering of Cas9-sgRNA using pAG-DIRECTED particles in the absence of an antibody or with a CD5-targeting antibody for VSV-Gdm+pAG (p-values: 0.0408, 0.01419, 0.000408), COCVmut+pAG (p-values: 0.000582, 0.000342, 0.345), GP64+pAG (p-values: 8.25E-05, 0.000393, 1.15E-05), or WT VSV-G (p-values: 1, 1, 0.324) at different doses (N = 3 for each condition). c (Left) Histogram of CD3 or CD5 surface expression on Jurkat E6 cells by flow cytometry. (Middle) Loss of B2M surface expression upon treatment of Jurkat E6 cells with VSV-Gdm+pAG-DIRECTED particles in the absence of antibody or upon targeting of CD3 or CD5. [p-values: 0.005672, 0.002088, 0.0001464, 0.002368, 0.024, 7.22E-07, 0.008, 0.0001704] (Right) Analysis of the surface level of B2M after using VSV-Gdm+SNAP-DIRECTED particles without removal of excess antibody in the same conditions as before. [p-values: 0.552, 5.31E-05, 0.528, 0.0001664, 0.12, 8.56E-05, 1, 1.14E-05] (N = 3 for each condition) For panels (a), (b), and (c), a two-sided Welch’s t-test with Bonferroni correction was used. [ns, not significant; *p < 0.05; **p < 0.01; ***p < 0.001; ****p < 0.0001]. Data are presented as the mean with the error bars indicating the sample standard deviation. Source data are provided as a Source Data file.
Fig. 6
Fig. 6. DIRECTED enables specific targeting in complex environments.
a Cell type composition [in percent] of PBMCs as determined by flow cytometry after staining for specific surface markers. b Delivery efficiency of H2B-mCherry transgene to primary human T cells in PBMCs from three donors by VSV-G and VSV-Gdm+SNAP lentiviral vectors in the absence of antibody (VSV-Gdm) or functionalized with B cell targeting ligands (αCD19-BG, MegaCD40L-BG; VSV-Gdm-Bcell), T cell targeting ligands (αCD3-BG, αCD28-BG, αCD4-BG; VSV-Gdm-Tcell), or αCD3-BG (VSV-Gdm-αCD3). Shown is the percent of mCherry+ CD4+ (left, p-values: 0.083, 0.018666667, 0.004, 0.04, 0.032, 0.032) or mCherry+ CD8+ T cells (right, p-values: 0.050285714, 0.050285714, 0.004, 0.050285714, 0.333, 0.032). VSV-G and VSV-Gdm: MOI of 500, other variants: MOI of 250 (N = 2 infections per donor for 3 donors) c Delivery efficiency of H2B-mCherry transgene to primary human B cells in PBMCs from three donors by WT VSV-G, WT VSV-G+SNAP, VSV-Gdm+SNAP (VSV-Gdm), VSV-G+ αCD19-BG, MegaCD40L-BG (VSV-G-Bcell), and VSV-Gdm+ αCD19-BG, MegaCD40L-BG (VSV-Gdm-Bcell). VSV-G, VSV-G+SNAP and VSV-Gdm: MOI of 3500; VSV-Gdm-Bcell, and VSV-G-Bcell: MOI of 1750. (N = 2 independent infections per donor for 3 donors, p-values: 0.021, 0.883, 0.001, 0.627) d (left) Schematic highlighting defense mechanisms in whole blood. (right) Cell type composition of whole blood after removal of red blood cells. e Delivery efficiency of H2B-mCherry transgene to primary human T cells in whole blood from two donors by VSV-G and VSV-Gdm+SNAP lentiviral vectors in the absence of antibody (VSV-Gdm) or functionalized with T cell targeting ligands (VSV-Gdm-Tcell), or αCD3-BG (VSV-Gdm-αCD3). Shown is the percent of mCherry+ CD4+ T cells (left, p-values: 0.079, 0.037, 0.075) or mCherry+ CD8+ T cells (right, p-values: 0.014, 0.048, 0.161). VSV-G and VSV-Gdm: MOI of 1000; VSV-Gdm-Bcell, VSV-Gdm-Tcell, and VSV-Gdm-αCD3: MOI of 500. MOIs were calculated estimating 5000 leukocytes per μl of whole blood. (N = 2 infections per donor for 2 donors) Data are presented as mean ± standard deviation. Source data are provided as a Source Data file. For panel (b), a paired, two-sided Welch’s t-test with BH correction was used, and for panels (c) and (e), a two-sided Welch’s t-test was used. [ns, not significant; *p < 0.05; **p < 0.01; ***p < 0.001; ****p < 0.0001].

Similar articles

Cited by

References

    1. Raguram A, Banskota S, Liu DR. Therapeutic in vivo delivery of gene editing agents. Cell. 2022;185:2806–2827. doi: 10.1016/j.cell.2022.03.045. - DOI - PMC - PubMed
    1. Tabebordbar M, et al. Directed evolution of a family of AAV capsid variants enabling potent muscle-directed gene delivery across species. Cell. 2021;184:4919–4938.e22. doi: 10.1016/j.cell.2021.08.028. - DOI - PMC - PubMed
    1. Deverman BE, et al. Cre-dependent selection yields AAV variants for widespread gene transfer to the adult brain. Nat. Biotechnol. 2016;34:204–209. doi: 10.1038/nbt.3440. - DOI - PMC - PubMed
    1. Naldini L, et al. In vivo gene delivery and stable transduction of nondividing cells by a lentiviral vector. Science. 1996;272:263–267. doi: 10.1126/science.272.5259.263. - DOI - PubMed
    1. Mangeot PE, et al. Genome editing in primary cells and in vivo using viral-derived nanoblades loaded with Cas9-sgRNA ribonucleoproteins. Nat. Commun. 2019;10:45. doi: 10.1038/s41467-018-07845-z. - DOI - PMC - PubMed

Publication types