Visualizing burst spots on research for four authors in MDPI journals named to be Citation Laureates 2021 using temporal bar graph
- PMID: 37565889
- PMCID: PMC10419625
- DOI: 10.1097/MD.0000000000034578
Visualizing burst spots on research for four authors in MDPI journals named to be Citation Laureates 2021 using temporal bar graph
Abstract
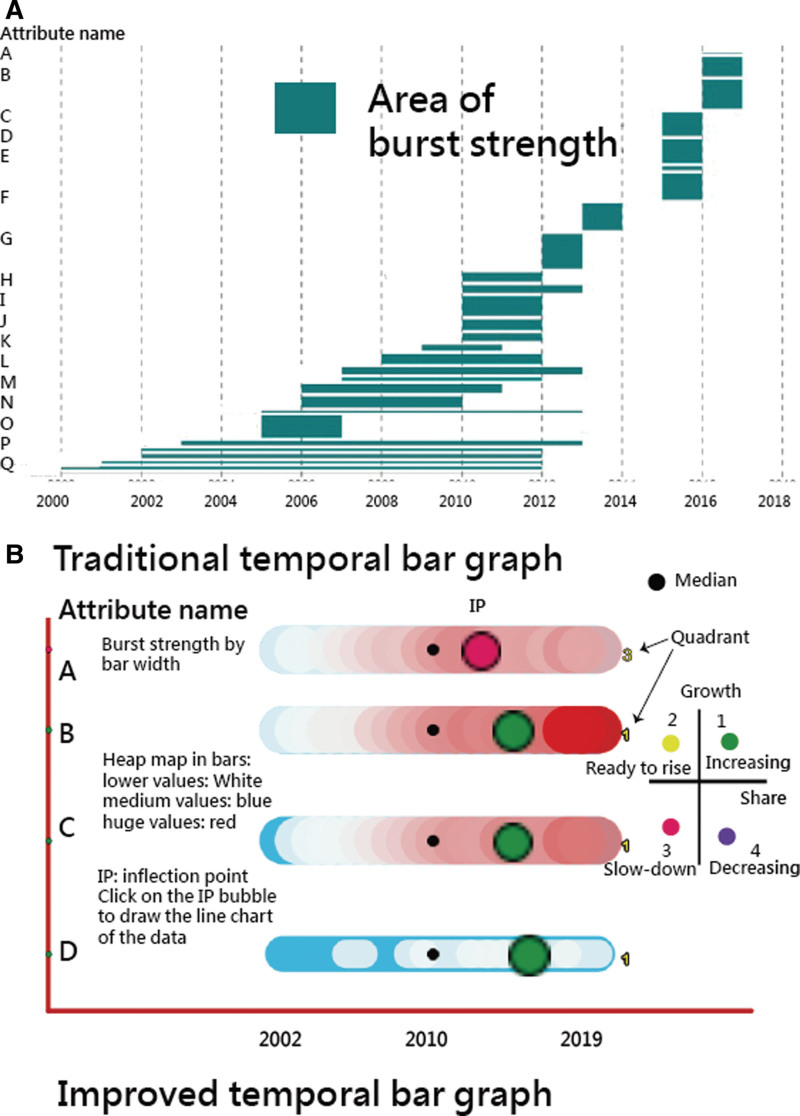
Background: The appearance of a topic in a document stream is signaled by a burst of activity, with certain features rising sharply in frequency as the topic emerges. Although temporal bar graph (TBG) is frequently applied to present the burst spot in the bibliographical study, none of the research has combined the inflection point (IP) to interpret the burst spot feature. The aims of this study are to improve the traditional TBG and apply the TBG to understand better the evolution of a topic (e.g., publications and citations for a given author).
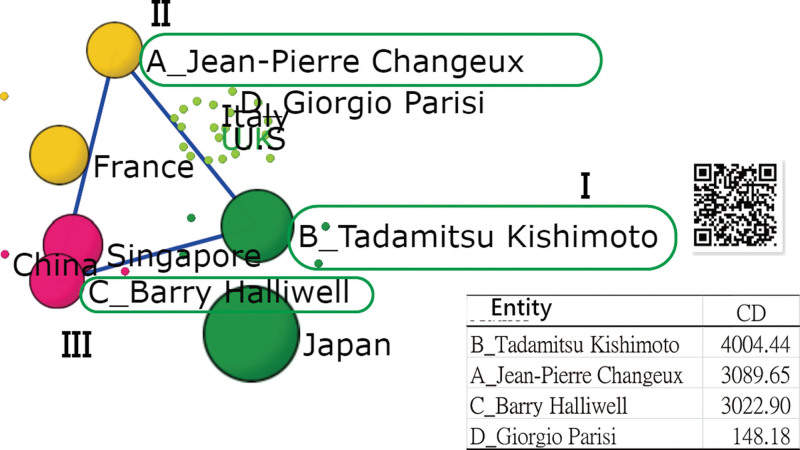
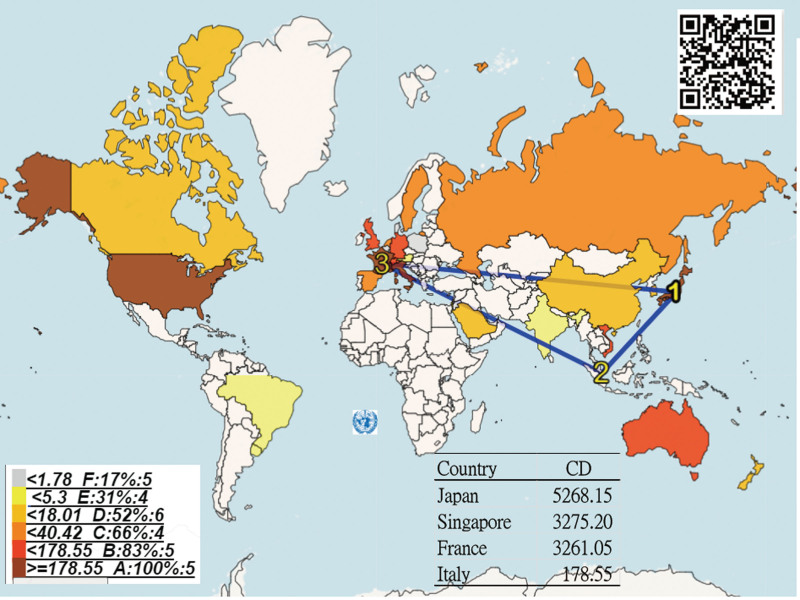
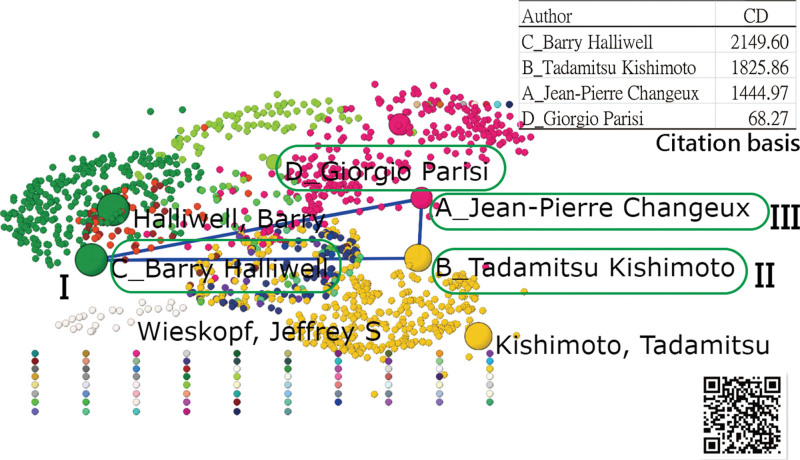
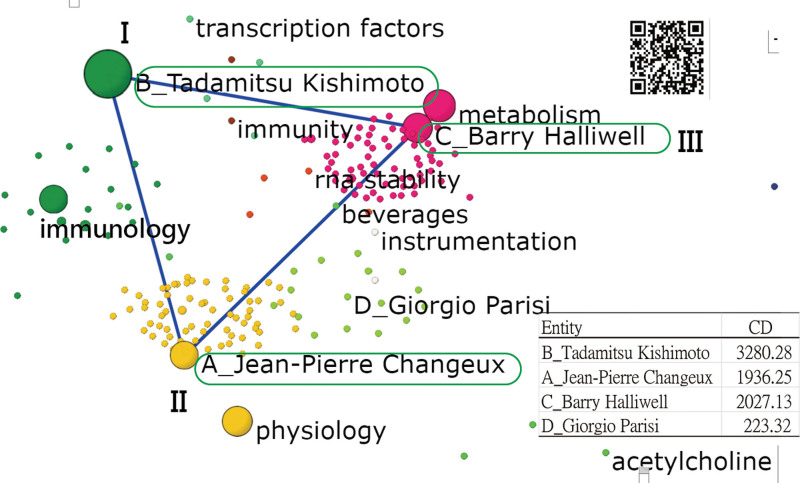
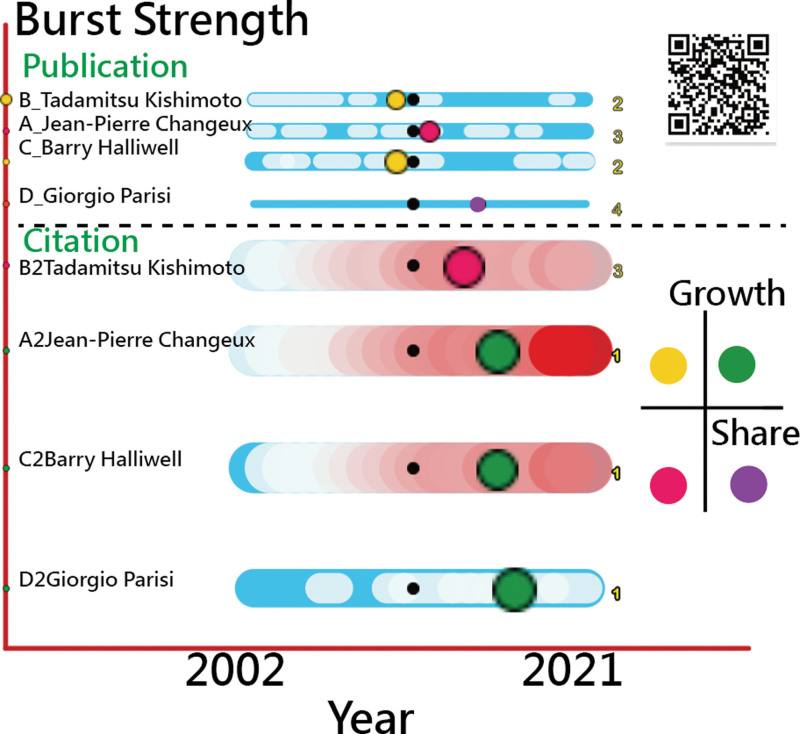
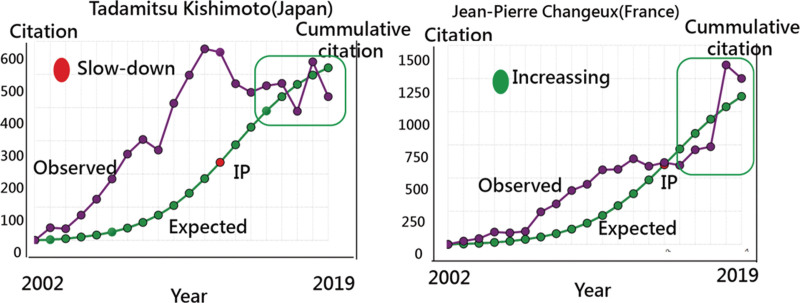
Methods: The EISTL model, including entity, indicator, selection of a few vital ones (named attributes) with higher values in quantity (e.g., the citation data of the top 10 entities), TBG and line-chart plots to verify the trend of interest, was proposed to demonstrate the TBG as a whole. The IP locations compared to the median point in data along with the heap map and line-chart trend were identified. The burst strength was computed. A dashboard on Google Maps was designed and launched for bibliometric analysis. Four authors in MDPI (Multidisciplinary Digital Publishing Institute) journals named to be Citation Laureates 2021 were recruited to compare their research achievements shown on the TBG, particularly displaying the burst spots and the recent developments and stages (e.g., increasing, ready to increase, slowdown, or decreasing).
Results: We observed that the highest burst strengths in publication and citations are earned by Barry Halliwell (8.99) and Jean-Pierre Changeux (18.01). The breakthrough of TBG using the EISTL model to display the influence of authors in academics was made with 2 parts of the primary IP point and the trend feature in the data.
Conclusion: The dashboard-type TBG shown on Google Maps is unique and innovative and able to provide deeper insights to readers, not merely limited to the publications and citations for a given author as we did in this study.
Copyright © 2023 the Author(s). Published by Wolters Kluwer Health, Inc.
Conflict of interest statement
The authors have no funding and conflicts of interest to disclose.
Figures
Similar articles
-
Trend and prediction of citations on the topic of neuromuscular junctions in 100 top-cited articles since 2001 using a temporal bar graph: A bibliometric analysis.Medicine (Baltimore). 2022 Oct 7;101(40):e30674. doi: 10.1097/MD.0000000000030674. Medicine (Baltimore). 2022. PMID: 36221404 Free PMC article.
-
Using the Sankey diagram to visualize article features on the topics of whole-exome sequencing (WES) and whole-genome sequencing (WGS) since 2012: Bibliometric analysis.Medicine (Baltimore). 2022 Sep 23;101(38):e30682. doi: 10.1097/MD.0000000000030682. Medicine (Baltimore). 2022. PMID: 36197161 Free PMC article.
-
Citation trends in ophthalmology articles and keywords in mainland China, Hong Kong, and Taiwan since 2013 using temporal bar graphs (TBGs): Bibliometric analysis.Medicine (Baltimore). 2022 Dec 30;101(52):e32392. doi: 10.1097/MD.0000000000032392. Medicine (Baltimore). 2022. PMID: 36596033 Free PMC article.
-
Italian research on anterior cruciate ligament: a bibliometric analysis.Eur J Orthop Surg Traumatol. 2024 Jul;34(5):2235-2243. doi: 10.1007/s00590-024-03937-3. Epub 2024 Apr 11. Eur J Orthop Surg Traumatol. 2024. PMID: 38602582 Review.
-
The "Golden Age" of quadriceps tendon grafts for the anterior cruciate ligament: a bibliometric analysis.J ISAKOS. 2024 Aug;9(4):672-681. doi: 10.1016/j.jisako.2024.03.007. Epub 2024 Mar 16. J ISAKOS. 2024. PMID: 38492850 Review.
Cited by
-
Analyzing shifts in age-related macular degeneration research trends since 2014: A bibliometric study with triple-map Sankey diagrams (TMSD).Medicine (Baltimore). 2024 Jan 19;103(3):e36547. doi: 10.1097/MD.0000000000036547. Medicine (Baltimore). 2024. PMID: 38241545 Free PMC article.
References
-
- Kleinberg J. Bursty and hierarchical structure in streams. Data Min Knowl Discov. 2003;7:373–97.
-
- MDPI. Four authors in MDPI journals named to be citation laureates 2021. Available at: https://fal.cn/3iBWc [access date October 14, 2021]. - PMC - PubMed
MeSH terms
LinkOut - more resources
Full Text Sources
Miscellaneous