. 2024 May;42(5):758-767.
doi: 10.1038/s41587-023-01863-z. Epub 2023 Jul 6.

De novo detection of somatic mutations in high-throughput single-cell profiling data sets

Affiliations

De novo detection of somatic mutations in high-throughput single-cell profiling data sets

Francesc Muyas et al. Nat Biotechnol. 2024 May.

Abstract

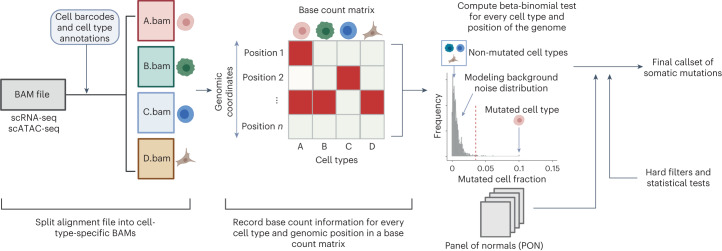
Characterization of somatic mutations at single-cell resolution is essential to study cancer evolution, clonal mosaicism and cell plasticity. Here, we describe SComatic, an algorithm designed for the detection of somatic mutations in single-cell transcriptomic and ATAC-seq (assay for transposase-accessible chromatin sequence) data sets directly without requiring matched bulk or single-cell DNA sequencing data. SComatic distinguishes somatic mutations from polymorphisms, RNA-editing events and artefacts using filters and statistical tests parameterized on non-neoplastic samples. Using >2.6 million single cells from 688 single-cell RNA-seq (scRNA-seq) and single-cell ATAC-seq (scATAC-seq) data sets spanning cancer and non-neoplastic samples, we show that SComatic detects mutations in single cells accurately, even in differentiated cells from polyclonal tissues that are not amenable to mutation detection using existing methods. Validated against matched genome sequencing and scRNA-seq data, SComatic achieves F1 scores between 0.6 and 0.7 across diverse data sets, in comparison to 0.2-0.4 for the second-best performing method. In summary, SComatic permits de novo mutational signature analysis, and the study of clonal heterogeneity and mutational burdens at single-cell resolution.


Conflict of interest statement

The authors declare no competing interests.

Figures

Fig. 1
Fig. 1. Overview of SComatic.
Methodology for detecting somatic mutations in high-throughput single-cell profiling data sets. The dashed red line shows an arbitrarily chosen level of significance for illustration purposes.
Fig. 2
Fig. 2. Validation of SComatic using matched scRNA-seq and exome sequencing data.
a, Mutational burdens for epithelial cells using the somatic SNVs detected by SComatic in cSCC and matched normal skin scRNA-seq data sets. The number of mutations is normalized to account for the variable number of callable sites in each sample. b, Fraction of somatic SNVs detected in epithelial cells attributed to COSMIC signatures. SBS signatures associated with ultraviolet radiation (SBS7a, SBS7b, SBS7c and SBS7d) and clock-like mutational processes (SBS5 and SBS40) are collapsed for visualization purposes. c, Mutational spectra computed for the mutations detected using SComatic in epithelial cells from cSCC and matched normal skin scRNA-seq data. The cosine similarities between the observed and reconstructed mutational spectra are shown. d, Venn diagram showing the overlap of the somatic SNVs detected by SComatic in epithelial cells using scRNA-seq data and WES data from the cSCC samples. ‘WES-specific beta-binomial’ refers to mutations detected in WES with at least one alternative read count in scRNA-seq that are not significant for the beta-binomial test. e, Decomposition of the mutations detected in scRNA-seq data only (scRNA-seq-specific mutations) into COSMIC signatures. f, Correlation between the mutational burdens estimated using the mutations detected in WES and the mutations detected by SComatic in the scRNA-seq data. The correlation was assessed using a linear regression model. Only genomic regions with sufficient sequencing depth in both the WES and scRNA-seq data were considered for this analysis. Mb, megabase. Source data
Fig. 3
Fig. 3. Comparison of the performance of SComatic against other mutation detection methods.
ac, Performance of Strelka2, SAMtools, VarScan2, Monovar, SCReadCounts and SComatic for the detection of somatic mutations in the scRNA-seq data from cSCC (a), ovarian cancer (b) and kidney tumor samples (c). The bars represent the mean value, and the error bars are the 95% bootstrap confidence interval for each statistic computed using 50 bootstrap resamples. Significance with respect to SComatic in ac was assessed using the two-sided Student’s t-test (***P < 0.0001). d, Decomposition into COSMIC signatures of the mutations detected in cSCC scRNA-seq data and in matched WES data. e, Decomposition into COSMIC signatures of the mutations detected in scRNA-seq and matched WGS data from ovarian cancer samples. f, Decomposition into COSMIC signatures of the mutations detected by SComatic in scRNA-seq from homologous recombination deficient (HRD) and homologous recombination proficient (HRP) ovarian cancer samples. g, Comparison between the mutational spectra of the mutations detected in cSCC samples using WES and scRNA-seq data for the algorithms benchmarked. The cosine similarities between the mutational spectra computed using the mutations detected in the scRNA-seq and the WES data are shown. Source data
Fig. 4
Fig. 4. Detection of somatic mutations in scRNA-seq data from colorectal cancer samples.
a, Mutational burden of epithelial cells computed using SComatic. The number of mutations is normalized to the number of callable sites per sample. b, Distribution of the mutational burden of epithelial cells from MSI tumors detected using SComatic and the mutational burden of MSI tumors from TCGA computed using WES data. The red horizontal line shows the mean for each group, and n indicates the number of samples per group. Statistical significance was assessed using the two-sided Student’s t-test. c, Decomposition of the mutational spectra computed using SComatic into COSMIC signatures. Mutational signatures associated with MMR deficiency (MMRd) (SBS6, SBS14, SBS15, SBS21, SBS26 and SBS44), POLE deficiency (POLEd) (SBS10a, SBS10b and SBS28) and clock-like mutational processes (SBS5 and SBS40) are collapsed for visualization purposes. d, Trinucleotide context of somatic mutations detected by SComatic using the scRNA-seq data from colorectal cancer samples. CRC, colorectal cancer; TCGA, The Cancer Genome Atlas. Source data
Fig. 5
Fig. 5. Detection of somatic mutations in samples with a low tumor mutational burden.
a, Trinucleotide context of somatic mutations detected in HSCs from patients with MPNs. b, Decomposition of the somatic mutations detected in HSCs from patients with MPNs into COSMIC signatures. c, Correlation between the mutational burden of HSCs estimated using SComatic and the age of patients at the time of sampling (Pearson’s correlation test). d, Average number of mutations detected per cell and genome in cardiomyocytes from the heart cell atlas across donors. e, Decomposition of the mutations detected in cardiomyocytes into COSMIC signatures. f, Trinucleotide context of mutations detected in cardiomyocytes from the heart cell atlas. g, Average mutational burden of individual cells across the tissues included in the GTEx scRNA-seq data set. h, Decomposition of the mutations detected across all cells from the GTEx data set into COSMIC signatures. i, Trinucleotide context of mutations detected across all single cells from the GTEx data set. The numbers on top of the bars in d and g indicate the number of cells per cell type analyzed, and the horizontal red dashed line corresponds to 1,000 mutations per cell. Source data
Fig. 6
Fig. 6. Analysis of intra-tumor heterogeneity using somatic mutations detected by SComatic in the scRNA-seq data from a patient with ovarian cancer (SPECTRUM-OV-003).
a, Hierarchical clustering of single cells from all tumor regions (columns) by somatic mutations (rows; mutations are labeled arbitrarily). Mutations detected in the scRNA-seq data are shown in red. White denotes the absence of mutations in the scRNA-seq data in cases when the site was sufficiently covered (at least one sequencing read), and gray indicates that there was no coverage at the position to make a call. b, Hierarchical clustering of single cells collected from the upper right quadrant region from patient SPECTRUM-OV-003. Only the mutations shown in a that were detected in at least 20 cells are shown. The two clones defined by somatic mutations detected in scRNA-seq data are marked on the y axis. Single cells and mutations in a and b are ordered by hierarchical clustering (top and left-hand side dendrograms, respectively). The color bar indicates the cancer cell fraction (CCF) of the mutations in the WGS data. NA, no coverage in scRNA-seq. Source data

Similar articles

Cited by

References

    1. Neftel C, et al. An integrative model of cellular states, plasticity, and genetics for glioblastoma. Cell. 2019;178:835–849.e21. doi: 10.1016/j.cell.2019.06.024. - DOI - PMC - PubMed
    1. Kakiuchi N, Ogawa S. Clonal expansion in non-cancer tissues. Nat. Rev. Cancer. 2021;21:239–256. doi: 10.1038/s41568-021-00335-3. - DOI - PubMed
    1. Nam AS, Chaligne R, Landau DA. Integrating genetic and non-genetic determinants of cancer evolution by single-cell multi-omics. Nat. Rev. Genet. 2021;22:3–18. doi: 10.1038/s41576-020-0265-5. - DOI - PMC - PubMed
    1. Lim B, Lin Y, Navin N. Advancing cancer research and medicine with single-cell genomics. Cancer Cell. 2020;37:456–470. doi: 10.1016/j.ccell.2020.03.008. - DOI - PMC - PubMed
    1. Gawad C, Koh W, Quake SR. Single-cell genome sequencing: current state of the science. Nat. Rev. Genet. 2016;17:175–188. doi: 10.1038/nrg.2015.16. - DOI - PubMed