. 2023 May 2;26(6):106783.
doi: 10.1016/j.isci.2023.106783. eCollection 2023 Jun 16.

Single-cell phenotypic plasticity modulates social behavior in Dictyostelium discoideum

Affiliations

Single-cell phenotypic plasticity modulates social behavior in Dictyostelium discoideum

Mathieu Forget et al. iScience. .

Abstract

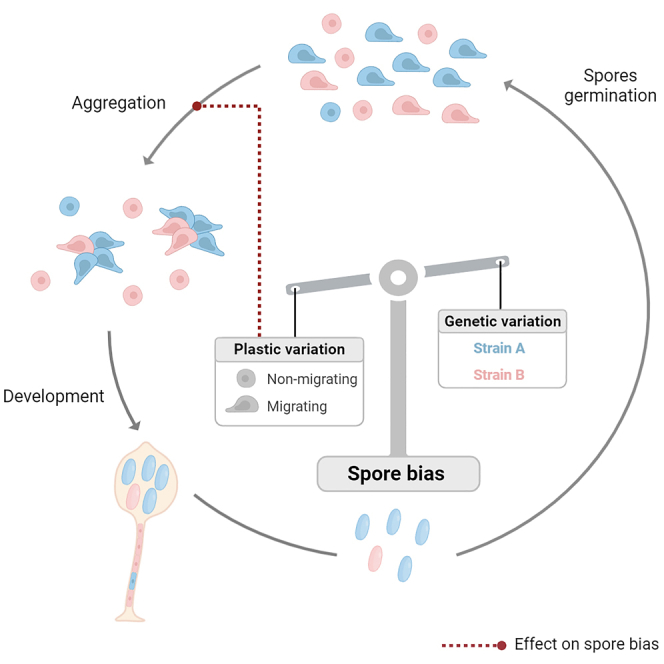
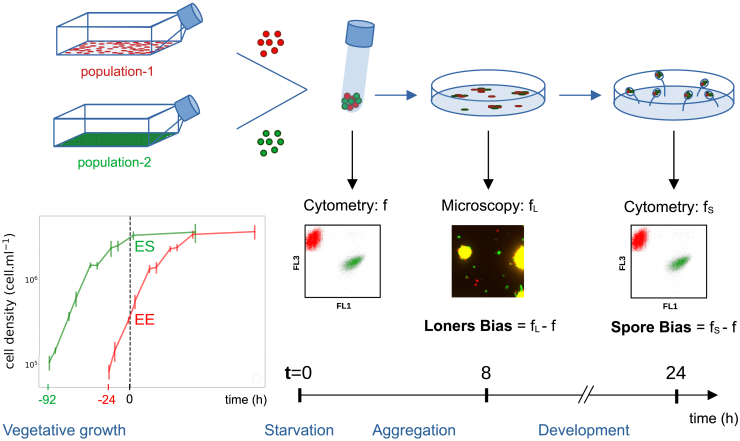
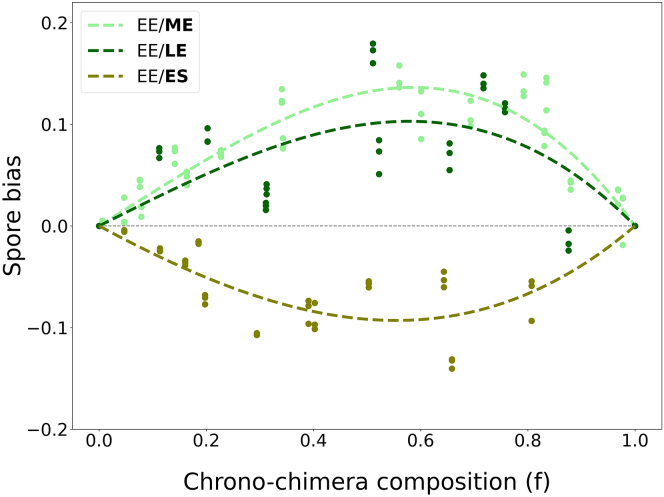
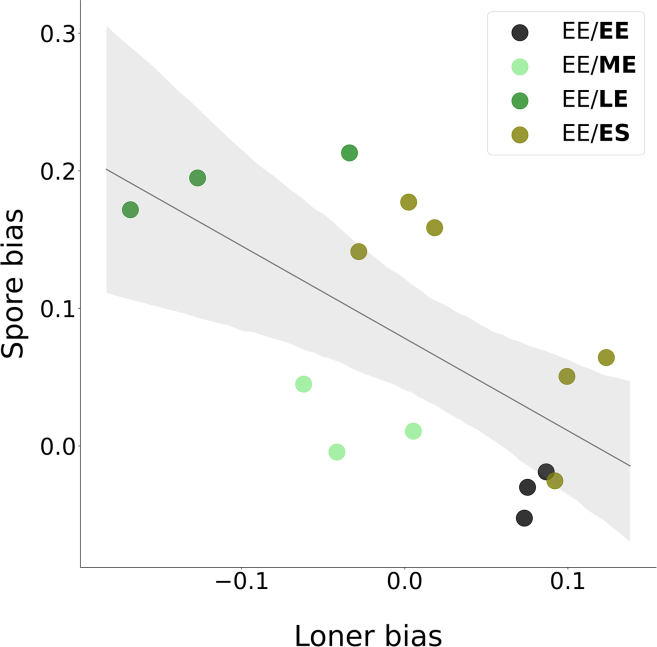
In Dictyostelium chimeras, "cheaters" are strains that positively bias their contribution to the pool of spores, i.e., the reproductive cells resulting from development. On evolutionary time scales, the selective advantage; thus, gained by cheaters is predicted to undermine collective functions whenever social behaviors are genetically determined. Genotypes; however, are not the sole determinant of spore bias, but the relative role of genetic and plastic differences in evolutionary success is unclear. Here, we study chimeras composed of cells harvested in different phases of population growth. We show that such heterogeneity induces frequency-dependent, plastic variation in spore bias. In genetic chimeras, the magnitude of such variation is not negligible and can even reverse the classification of a strain's social behavior. Our results suggest that differential cell mechanical properties can underpin, through biases emerging during aggregation, a "lottery" in strains' reproductive success that may counter the evolution of cheating.

Keywords: Cell biology; Evolutionary biology; Microbiology.


Conflict of interest statement

The authors declare no competing interests.

Figures

None
Graphical abstract
Figure 1
Figure 1
Schematic representation of the experimental protocol to produce chrono-chimeras Cell populations carrying green or red fluorescent markers were harvested at a specific phase of their logistic growth. Cultures were started at different discrete times before the beginning of the experiment. When the culture was started 24 h before, cells were called Early Exponential (EE), and they were called Mid-Exponential (ME), Late Exponential (LE), or Early Stationary (ES) when they had been cultured for 46, 68, or 92 h, respectively. Figure S1 illustrates where in the culture’s growth curve these time are located. As detailed in the STAR methods, different measures were realized in order to characterize the way biases got established in the course of the multicellular cycle, which was triggered at time t=0 by cell starvation and plating on petri dishes covered with Phytagel. Before the start of aggregation, the fraction f of cells of one population was measured by flow cytometry. Similarly, the fraction fS of the same population in the spores was performed after completion of development, 24 h later. Time-lapse movies of the aggregation were recorded on an inverted microscope, allowing to count the proportion fL of each population within the fraction of cells that remained outside aggregates (the so-called “loners”). Moreover, measures of single cell properties (discussed later in the text) were realized at t=0 in order to connect initial phenotypic variability to realized biases.
Figure 2
Figure 2
Spore bias profiles depend on growth phase-induced phenotypic variation Corrected (see STAR Methods) spore bias for a focal AX3-GFP population harvested in different growth phases (indicated in bold in the legend), mixed to a reference AX3-RFP EE population, as a function of the proportion f of the focal strain. Measures of spore bias were realized in three replicates (same initial mix plated on three different plates). The observations have been interpolated (dashed lines) with a third degree polynomial constrained with f=0 and f=1.
Figure 3
Figure 3
Spore bias negatively correlates with loner bias Corrected spore bias (see main text and STAR methods) as a function of loner bias in isogenic chrono-chimeras composed of the strain AX3-GFP with f50% of a reference AX3-RFP EE population. The growth phase of the focal population (AX3-GFP) is indicated in bold in the legend.
Figure 4
Figure 4
Variation of cell adhesion and motility properties in the course of vegetative growth of AX3 populations (A–C) Cell-substrate adhesion increases (A), cell-cell adhesion decreases (B) and the proportion of non-migrating cells (see Figure 5) decreases as a population ages (C). In each assay, three replicates were performed for each condition. Error bars indicate the standard deviation of the proportion of attached cells or non-migrating cells. ∗: Student test p value < 0.05 ∗∗: Student test p value < 0.005.
Figure 5
Figure 5
AX3 populations display a bimodal distribution of cell motility (A) Individual mean square displacement as a function of time lag (Δt). (B) Distribution of the initial rate of increase of the MSD (slope of the log MSD vs. log Δt, Δt<150 secs). Cells were clustered into two motility classes (indicated in all panels in red and blue respectively), where such slope was below or above the threshold value 0.5. (C) Total displacement of cells from these two classes in the course of 1 h, showing that the initial slope is a good proxy for how much cells displace (Error bars indicate the standard deviation of total cell displacement. ∗∗∗: Mann–Whitney U test p value <0.0005.). (D): Typical cell trajectories from the two motility classes with their origins brought to a common point, illustrating the difference in motility. Results are shown for one LE population (see Figures S5 and S6 for all replicates and growth phases).
Figure 6
Figure 6
Social behavior in chimeras depends on populations growth phase at the onset of aggregation Spore bias measured in two different genetic chimeras, using a population of AX3-RFP cells as the focal population. (A) chrono-chimeras composed of AX3-RFP and chtA cells. (B) chrono-chimeras composed of AX3-RFP and AX2 cells. Three different cases are considered: strains are grown in co-culture and harvested in ME phase, the focal population is harvested in EE phase and the other in LE phase (dark blue line), or vice-versa (light blue line).

Similar articles

References

    1. Strassmann J.E., Queller D.C. Evolution of cooperation and control of cheating in a social microbe. Proc. Natl. Acad. Sci. USA. 2011;108:10855–10862. doi: 10.1073/pnas.1102451108. - DOI - PMC - PubMed
    1. Forget M., Adiba S., De Monte S. Social conflicts in Dictyostelium discoideum : a matter of scales. Peer Community Journal. 2021;1:e58. doi: 10.24072/pcjournal.39. - DOI
    1. Raper K.B. Pseudoplasmodium formation and organization in Dictyostelium discoideum. J. Elisha Mitchell Sci. Soc. 1940;56:241–282.
    1. Smith J., Queller D.C., Strassmann J.E. Fruiting bodies of the social amoeba Dictyostelium discoideum increase spore transport by Drosophila. BMC evolutionary biology. 2014;14:105. doi: 10.1186/1471-2148-14-105. - DOI - PMC - PubMed
    1. Fortunato A., Strassmann J.E., Santorelli L., Queller D.C. Co-occurrence in nature of different clones of the social amoeba, Dictyostelium discoideum. Mol. Ecol. 2003;12:1031–1038. doi: 10.1046/j.1365-294X.2003.01792.x. - DOI - PubMed

LinkOut - more resources