Review
. 2022 May 6;14(5):1001.
doi: 10.3390/pharmaceutics14051001.

A Comprehensive Overview of Globally Approved JAK Inhibitors

Affiliations
Review

A Comprehensive Overview of Globally Approved JAK Inhibitors

Ahmed M Shawky et al. Pharmaceutics. .

Abstract

Janus kinase (JAK) is a family of cytoplasmic non-receptor tyrosine kinases that includes four members, namely JAK1, JAK2, JAK3, and TYK2. The JAKs transduce cytokine signaling through the JAK-STAT pathway, which regulates the transcription of several genes involved in inflammatory, immune, and cancer conditions. Targeting the JAK family kinases with small-molecule inhibitors has proved to be effective in the treatment of different types of diseases. In the current review, eleven of the JAK inhibitors that received approval for clinical use have been discussed. These drugs are abrocitinib, baricitinib, delgocitinib, fedratinib, filgotinib, oclacitinib, pacritinib, peficitinib, ruxolitinib, tofacitinib, and upadacitinib. The aim of the current review was to provide an integrated overview of the chemical and pharmacological data of the globally approved JAK inhibitors. The synthetic routes of the eleven drugs were described. In addition, their inhibitory activities against different kinases and their pharmacological uses have also been explained. Moreover, their crystal structures with different kinases were summarized, with a primary focus on their binding modes and interactions. The proposed metabolic pathways and metabolites of these drugs were also illustrated. To sum up, the data in the current review could help in the design of new JAK inhibitors with potential therapeutic benefits in inflammatory and autoimmune diseases.

Keywords: JAK; binding mode/interactions; kinase inhibitory activity; pharmacological uses; synthesis.


Conflict of interest statement

Authors declared that there is no conflict of interest and have approved the article.

Figures

Figure 1
Figure 1
Domain structure of JAKs.
Figure 2
Figure 2
JAK-STAT pathway.
Figure 3
Figure 3
Classification of JAK inhibitors with representative examples for each type.
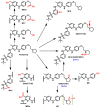
Figure 4
Figure 4
JAK2 inhibitors, NVP-BBT594 and NVP-CHZ868.
Figure 5
Figure 5
Allosteric JAKs inhibitors.
Figure 6
Figure 6
JAK3 covalent inhibitors.
Figure 7
Figure 7
JAK3 (pdb: 5TOZ) bound to ritlecitinib: (A) 3D representation of JAK3 bound to ritlecitinib (shown as CPK); (B) 3D binding mode of ritlecitinib showing one covalent bond with Cys909, hydrogen bonds (shown as green-dotted lines), and multiple hydrophobic interactions, this figure was generated using Discovery Studio Visualizer (V16.1.0.15350).
Figure 8
Figure 8
JAK1 (pdb: 6N7A) and JAK2 (pdb: 2B7A) kinases bound to small-molecule inhibitors: (A) 3D representation of JAK1 bound to KEV (shown as CPK); (B) 3D binding mode of KEV into JAK1 showing the hydrogen bond interactions; (C) 3D representation of JAK2 bound to IZA (shown as CPK); (D) 3D binding mode of IZA into JAK2, hydrogen bonds are shown as green-dotted lines, this figure was generated using Discovery Studio Visualizer (V16.1.0.15350).
Figure 9
Figure 9
JAK3 (pdb: 3PJC) and TYK2 (pdb: 6VNX) kinases bound to small-molecule inhibitors: (A) 3D representation of JAK3 bound to PJC (shown as CPK); (B) 3D binding mode of PJC into JAK3; (C) 3D representation of TYK2 bound to R4V (shown as CPK); (D) 3D binding mode of R4V into TYK2, this figure was generated using Discovery Studio Visualizer (V16.1.0.15350).
Figure 10
Figure 10
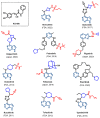
Chemical structure of AG-490 and the globally proven JAK inhibitors with the dates of their first approval.
Figure 11
Figure 11
Chemical structure/name/synonyms of abrocitinib.
Scheme 1
Scheme 1
Synthesis of abrocitinib (route 1).
Scheme 2
Scheme 2
Synthesis of abrocitinib (route 2).
Figure 12
Figure 12
JAKs inhibitory activities of abrocitinib.
Figure 13
Figure 13
Binding modes of abrocitinib (shown as sticks) into JAK1 (pdb: 6BBU): (A) 3D binding mode, receptor shown as a hydrogen bond surface; (B) 2D binding mode showing different types of binding interactions with amino acids in JAK1; this figure was generated using Discovery Studio Visualizer (V16.1.0.15350).
Figure 14
Figure 14
Binding modes of abrocitinib (shown as sticks) into JAK2 (pdb: 6BBV): (A) 3D binding mode, receptor shown as a hydrogen bond surface; (B) 2D binding mode showing different types of binding interactions with amino acids in JAK2; this figure was generated using Discovery Studio Visualizer (V16.1.0.15350).
Figure 15
Figure 15
Proposed metabolic pathways and metabolites of abrocitinib.
Figure 16
Figure 16
Chemical structure/name/synonyms of baricitinib.
Scheme 3
Scheme 3
Synthesis of baricitinib (route 1).
Scheme 4
Scheme 4
Synthesis of baricitinib (route 2).
Figure 17
Figure 17
JAKs inhibitory activities of baricitinib.
Figure 18
Figure 18
Binding modes of baricitinib (shown as sticks) into BMP-2-inducible kinase (pdb: 4W9X): (A) 3D binding mode, receptor shown as a hydrogen bond surface; (B) 2D binding mode showing different types of binding interactions with amino acids in BMP-2-inducible kinase; this figure was generated using Discovery Studio Visualizer (V16.1.0.15350).
Figure 19
Figure 19
Binding modes of baricitinib (shown as sticks) into JAK2 JH1 (pdb: 6VN8): (A) 3D binding mode, receptor shown as a hydrogen bond surface; (B) 2D binding mode showing different types of interactions with JAK2 JH1; the figure was generated using Discovery Studio Visualizer (V16.1.0.15350).
Figure 20
Figure 20
Binding modes of baricitinib (shown as sticks) into human JAK2 JH1 (pdb: 6WTO): (A) 3D binding mode, receptor shown as a hydrogen bond surface; (B) 2D binding mode showing different types of interactions with JAK2 JH1; the figure was generated using Discovery Studio Visualizer (V16.1.0.15350).
Figure 21
Figure 21
Proposed metabolic pathways and major metabolites of baricitinib in human, asterisks indicate the sites of oxidation.
Figure 22
Figure 22
Chemical structure/name/synonyms of delgocitinib.
Scheme 5
Scheme 5
Synthesis of delgocitinib (route 1).
Scheme 6
Scheme 6
Synthesis of delgocitinib (route 2).
Figure 23
Figure 23
Kinase inhibitory activity of delgocitinib.
Figure 24
Figure 24
Binding modes of delgocitinib (shown as sticks) into JAK3 (pdb: 7C3N): (A) 3D binding mode, receptor shown as a hydrogen bond surface; (B) 2D binding mode showing different types of interactions with JAK3; this figure was generated using Discovery Studio Visualizer (V16.1.0.15350).
Figure 25
Figure 25
Proposed metabolic pathways and major metabolites of delgocitinib based on the data of the deliberation results [103].
Figure 26
Figure 26
Chemical structure/name/synonyms of fedratinib.
Scheme 7
Scheme 7
Synthesis of fedratinib.
Figure 27
Figure 27
Kinase inhibitory activity of fedratinib (* fold selectivity compared with JAK2).
Figure 28
Figure 28
Binding modes of fedratinib (shown as sticks) into human bromodomain BRD4 (pdb: 4OGJ): (A) 3D binding mode, receptor shown as a hydrogen bond surface; (B) 2D binding mode showing different types of interactions with BRD4; the figure was generated using Discovery Studio Visualizer (V16.1.0.15350).
Figure 29
Figure 29
Binding modes of fedratinib (shown as sticks) into human bromodomain BRD4 (pdb: 4PS5): (A) 3D binding mode, receptor shown as a hydrogen bond surface; (B) 2D binding mode showing different types of interactions with BRD4; the figure was generated using Discovery Studio Visualizer (V16.1.0.15350).
Figure 30
Figure 30
Binding modes of fedratinib (shown as sticks) into JAK2 JH1 (pdb: 6VNE): (A) 3D binding mode, receptor shown as a hydrogen bond surface; (B) 2D binding mode showing different types of interactions with JAK2 JH1; the figure was generated using Discovery Studio Visualizer.
Figure 31
Figure 31
Proposed metabolic pathway and metabolites of fedratinib in humans.
Figure 32
Figure 32
Chemical structure/name/synonyms of filgotinib.
Scheme 8
Scheme 8
Synthesis of filgotinib.
Figure 33
Figure 33
Kinase inhibitory activity of filgotinib, * indicates the IC50 and index selectivity values determined using recombinant JAKs, ** indicates the IC50 values determined using a human whole blood assay [116,117].
Figure 34
Figure 34
Binding modes of filgotinib (shown as sticks) into JAK1 (pdb: 4P7E): (A) 3D binding mode, receptor shown as a hydrogen bond surface; (B) 2D binding mode showing different types of interactions with JAK1; the figure was generated using Discovery Studio Visualizer (V16.1.0.15350).
Figure 35
Figure 35
Binding modes of filgotinib (shown as sticks) into JAK2 JH2 (pdb: 5UT5): (A) 3D binding mode, receptor shown as a hydrogen bond surface; (B) 2D binding mode showing different types of interactions with JAK2 JH2; the figure was generated using Discovery Studio Visualizer (V16.1.0.15350).
Figure 36
Figure 36
Proposed metabolic pathway of filgotinib.
Figure 37
Figure 37
Chemical structure/name/synonyms of oclacitinib.
Scheme 9
Scheme 9
Synthesis of oclacitinib.
Figure 38
Figure 38
Kinase inhibitory activity of oclacitinib.
Figure 39
Figure 39
Chemical structure, name, and synonyms of pacritinib.
Scheme 10
Scheme 10
Synthesis of pacritinib.
Figure 40
Figure 40
Kinase inhibitory activities of pacritinib.
Figure 41
Figure 41
Binding modes of pacritinib (shown as sticks) into human quinone reductase 2 (NQO2) (pdb: 5LBZ): (A) 3D binding mode, receptor shown as a hydrogen bond surface; (B) 2D binding mode showing different types of binding interactions; this figure was generated using Discovery Studio Visualizer (V16.1.0.15350).
Figure 42
Figure 42
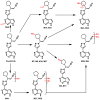
Proposed metabolic pathways and metabolites of pacritinib in human and mouse plasma.
Figure 43
Figure 43
Chemical structure/name/synonyms of peficitinib.
Scheme 11
Scheme 11
Synthesis of peficitinib.
Figure 44
Figure 44
Kinase inhibitory activities of peficitinib.
Figure 45
Figure 45
Binding modes of peficitinib (shown as sticks) into JAK1 (pdb: 6AAH): (A) 3D binding mode, receptor shown as a hydrogen bond surface; (B) 2D binding mode showing different types of interactions with JAK1; the figure was generated using Discovery Studio Visualizer (V16.1.0.15350).
Figure 46
Figure 46
Binding modes of peficitinib (shown as sticks) into JAK2 (pdb: 6AAJ): (A) 3D binding mode, receptor shown as a hydrogen bond surface; (B) 2D binding mode showing different types of interactions with JAK2; hydrogen atoms were omitted for clarity; this figure was generated using Discovery Studio Visualizer (V16.1.0.15350).
Figure 47
Figure 47
Binding modes of peficitinib (shown as sticks) into JAK3 (pdb: 6AAK): (A) 3D binding mode, receptor shown as a hydrogen bond surface; (B) 2D binding mode showing different types of interactions with JAK3; hydrogen atoms were omitted for clarity; this figure was generated using Discovery Studio Visualizer (V16.1.0.15350).
Figure 48
Figure 48
Binding modes of peficitinib (shown as sticks) into TYK2 (pdb: 6AAM): (A) 3D binding mode, receptor shown as a hydrogen bond surface; (B) 2D binding mode showing different types of interactions with TYK2; hydrogen atoms were omitted for clarity; this figure was generated using Discovery Studio Visualizer (V16.1.0.15350).
Figure 49
Figure 49
Proposed metabolic pathways and metabolites of peficitinib.
Figure 50
Figure 50
Chemical structure/name/synonyms of ruxolitinib.
Scheme 12
Scheme 12
Synthesis of ruxolitinib (route 1).
Scheme 13
Scheme 13
Synthesis of ruxolitinib (route 2).
Figure 51
Figure 51
Kinases inhibitory activity of ruxolitinib.
Figure 52
Figure 52
Binding modes of ruxolitinib (shown as sticks) into JAK2 JH1 (pdb: 6VGL): (A) 3D binding mode, receptor shown as a hydrogen bond surface; (B) 2D binding mode showing different types of interactions with JAK2 JH1; hydrogen atoms were omitted for clarity; this figure was generated using Discovery Studio Visualizer (V16.1.0.15350).
Figure 53
Figure 53
Binding modes of ruxolitinib (shown as sticks) into human JAK2 JH1 (pdb: 6WTN): (A) 3D binding mode, receptor shown as a hydrogen bond surface; (B) 2D binding mode showing different types of interactions with JAK2 JH1; hydrogen atoms were omitted for clarity; this figure was generated using Discovery Studio Visualizer (V16.1.0.15350).
Figure 54
Figure 54
Binding modes of ruxolitinib (shown as sticks) into JAK2 JH1 (pdb: 6VNK): (A) 3D binding mode, receptor shown as a hydrogen bond surface; (B) 2D binding mode showing different types of interactions with JAK2 JH1; hydrogen atoms were omitted for clarity; this figure was generated using Discovery Studio Visualizer (V16.1.0.15350).
Figure 55
Figure 55
Binding modes of ruxolitinib (shown as sticks) into c-Src (pdb: 4U5J): (A) 3D binding mode, receptor shown as a hydrogen bond surface; (B) 2D binding mode showing different types of interactions with c-Src; hydrogen atoms were omitted for clarity; this figure was generated using Discovery Studio Visualizer (V16.1.0.15350).
Figure 56
Figure 56
Binding modes of ruxolitinib (shown as sticks) into the DCLK1 kinase domain (pdb: 7F3G): (A) 3D binding mode, receptor shown as a hydrogen bond surface; (B) 2D binding mode showing different types of interactions with DCLK1 kinase domain; hydrogen atoms were omitted for clarity; this figure was generated using Discovery Studio Visualizer (V16.1.0.15350).
Figure 57
Figure 57
Proposed metabolic pathways and metabolites of ruxolitinib in humans.
Figure 58
Figure 58
Chemical structure/name/synonyms of tofacitinib.
Scheme 14
Scheme 14
Synthesis of tofacitinib citrate.
Figure 59
Figure 59
Kinase inhibitory activity of tofacitinib.
Figure 60
Figure 60
Binding modes of tofacitinib (shown as sticks) into JAK1 (pdb: 3EYG): (A) 3D binding mode, receptor shown as a hydrogen bond surface; (B) 2D binding mode showing different types of interactions with JAK1; hydrogen atoms were omitted for clarity; this figure was generated using Discovery Studio Visualizer (V16.1.0.15350).
Figure 61
Figure 61
Binding modes of tofacitinib (shown as sticks) into JAK2 (pdb: 3FUP): (A) 3D binding mode, receptor shown as a hydrogen bond surface; (B) 2D binding mode showing different types of interactions with JAK2; hydrogen atoms were omitted for clarity; this figure was generated using Discovery Studio Visualizer (V16.1.0.15350).
Figure 62
Figure 62
Binding modes of tofacitinib (shown as sticks) into JAK3 (pdb: 3LXK): (A) 3D binding mode, receptor depicted as a hydrogen bond surface; (B) 2D binding mode showing different types of interactions with JAK3; hydrogen atoms were omitted for clarity; this figure was generated using Discovery Studio Visualizer (V16.1.0.15350).
Figure 63
Figure 63
Binding modes of tofacitinib (shown as sticks) into TYK2 (pdb: 3LXN): (A) 3D binding mode, receptor shown as a hydrogen bond surface; (B) 2D binding mode showing different types of interactions with TYK2; hydrogen atoms were omitted for clarity; this figure was generated using Discovery Studio Visualizer (V16.1.0.15350).
Figure 64
Figure 64
Binding modes of tofacitinib (shown as sticks) into the PRK1 catalytic domain (pdb: 4OTI): (A) 3D binding mode, receptor shown as a hydrogen bond surface; (B) 2D binding mode showing different types of interactions with PRK1 catalytic domain; hydrogen atoms were omitted for clarity; this figure was generated using Discovery Studio Visualizer (V16.1.0.15350).
Figure 65
Figure 65
Proposed metabolic pathways and metabolites of tofacitinib.
Figure 66
Figure 66
Chemical structure/name/synonyms of upadacitinib.
Scheme 15
Scheme 15
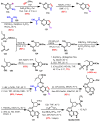
Synthesis of upadacitinib.
Figure 67
Figure 67
Kinase inhibitory activity of upadacitinib (* FS, fold selectivity compared to JAK1).
Figure 68
Figure 68
JAK inhibitors under development.

Similar articles

Cited by

References

    1. Yamaoka K., Saharinen P., Pesu M., Holt V.E.T., 3rd, Silvennoinen O., O’Shea J.J. The Janus kinases (Jaks) Genome Biol. 2004;5:253. doi: 10.1186/gb-2004-5-12-253. - DOI - PMC - PubMed
    1. Wilks A.F. Two putative protein-tyrosine kinases identified by application of the polymerase chain reaction. Proc. Natl. Acad. Sci. USA. 1989;86:1603–1607. doi: 10.1073/pnas.86.5.1603. - DOI - PMC - PubMed
    1. Banerjee S., Biehl A., Gadina M., Hasni S., Schwartz D.M. JAK-STAT signaling as a target for inflammatory and autoimmune diseases: Current and future prospects. Drugs. 2017;77:521–546. doi: 10.1007/s40265-017-0701-9. - DOI - PMC - PubMed
    1. Aittomäki S., Pesu M. Therapeutic targeting of the Jak/STAT pathway. Basic Clin. Pharmacol. Toxicol. 2014;114:18–23. doi: 10.1111/bcpt.12164. - DOI - PubMed
    1. Abroun S., Saki N., Ahmadvand M., Asghari F., Salari F., Rahim F. STATs: An old story, yet mesmerizing. Cell J. 2015;17:395–411. doi: 10.22074/cellj.2015.1. - DOI - PMC - PubMed