

Trophic interactions between predatory protists and pathogen-suppressive bacteria impact plant health
- PMID: 35461357
- PMCID: PMC9296445
- DOI: 10.1038/s41396-022-01244-5
Trophic interactions between predatory protists and pathogen-suppressive bacteria impact plant health
Abstract
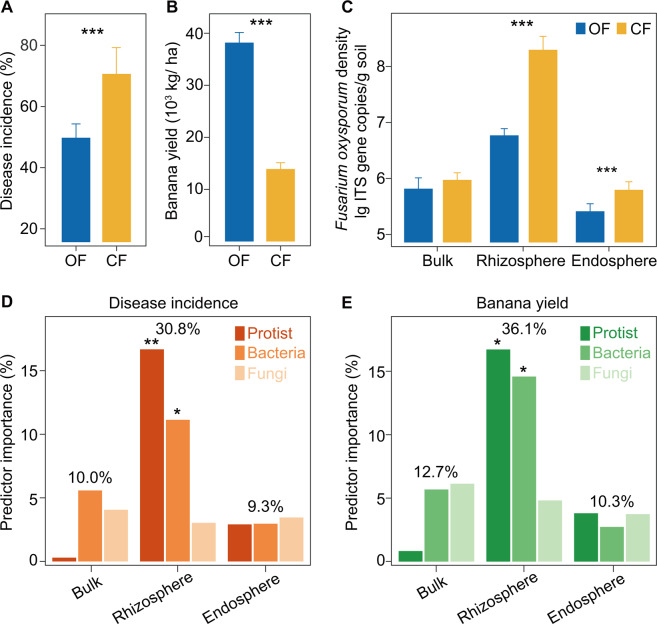
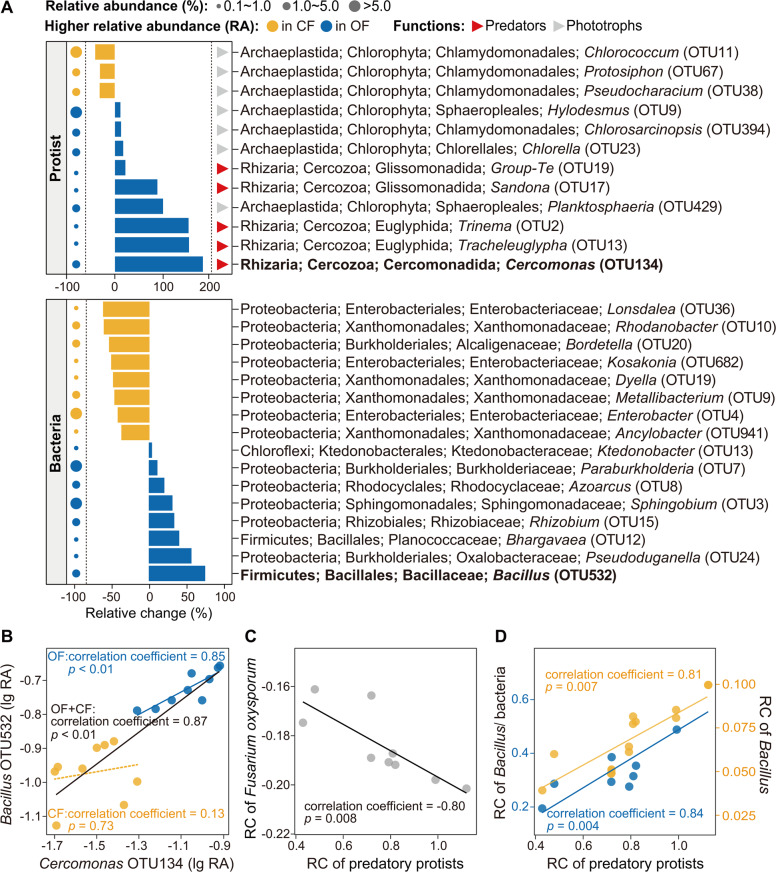
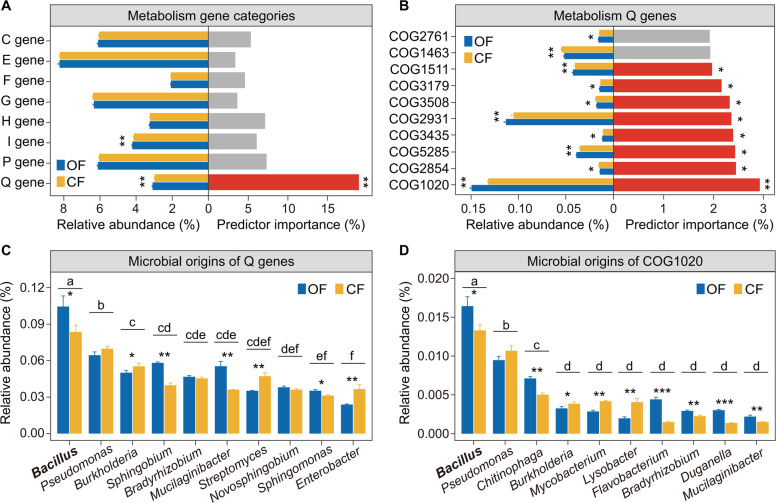
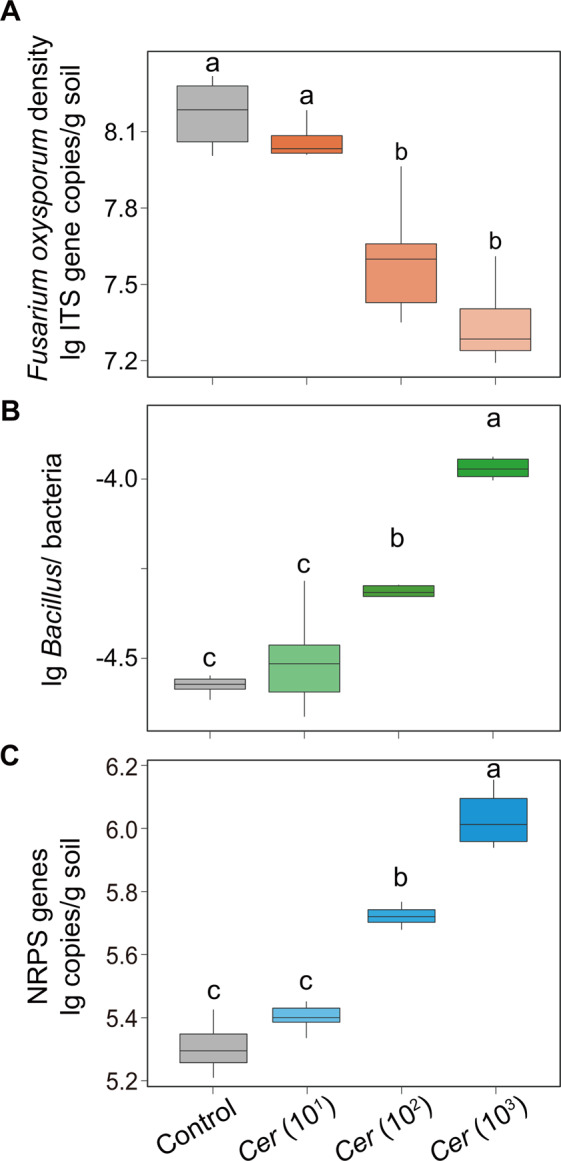
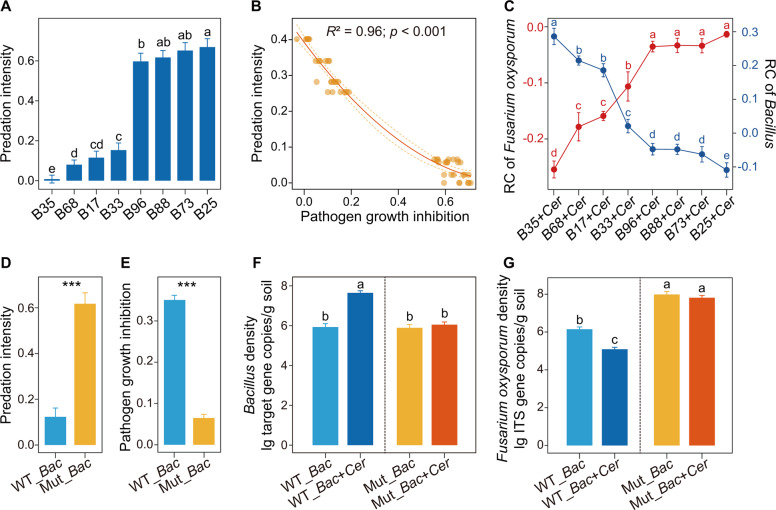
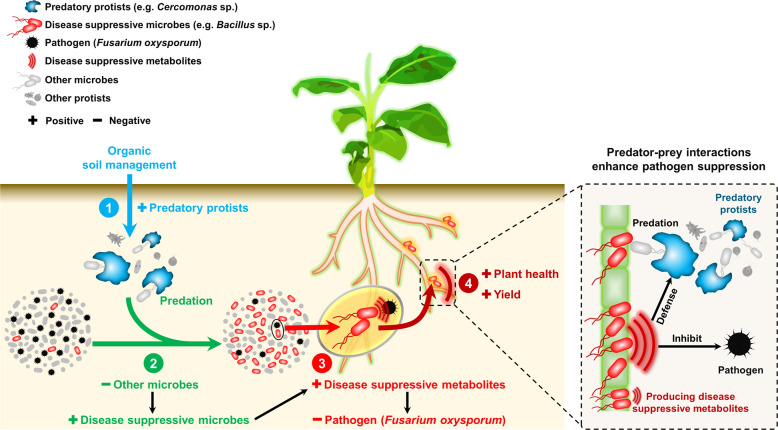
Plant health is strongly impacted by beneficial and pathogenic plant microbes, which are themselves structured by resource inputs. Organic fertilizer inputs may thus offer a means of steering soil-borne microbes, thereby affecting plant health. Concurrently, soil microbes are subject to top-down control by predators, particularly protists. However, little is known regarding the impact of microbiome predators on plant health-influencing microbes and the interactive links to plant health. Here, we aimed to decipher the importance of predator-prey interactions in influencing plant health. To achieve this goal, we investigated soil and root-associated microbiomes (bacteria, fungi and protists) over nine years of banana planting under conventional and organic fertilization regimes differing in Fusarium wilt disease incidence. We found that the reduced disease incidence and improved yield associated with organic fertilization could be best explained by higher abundances of protists and pathogen-suppressive bacteria (e.g. Bacillus spp.). The pathogen-suppressive actions of predatory protists and Bacillus spp. were mainly determined by their interactions that increased the relative abundance of secondary metabolite Q genes (e.g. nonribosomal peptide synthetase gene) within the microbiome. In a subsequent microcosm assay, we tested the interactions between predatory protists and pathogen-suppressive Bacillus spp. that showed strong improvements in plant defense. Our study shows how protistan predators stimulate disease-suppressive bacteria in the plant microbiome, ultimately enhancing plant health and yield. Thus, we suggest a new biological model useful for improving sustainable agricultural practices that is based on complex interactions between different domains of life.
© 2022. The Author(s), under exclusive licence to International Society for Microbial Ecology.
Conflict of interest statement
The authors declare no competing interests.
Figures
Similar articles
-
Predatory protists reduce bacteria wilt disease incidence in tomato plants.Nat Commun. 2024 Jan 27;15(1):829. doi: 10.1038/s41467-024-45150-0. Nat Commun. 2024. PMID: 38280866 Free PMC article.
-
Plant associated protists-Untapped promising candidates for agrifood tools.Environ Microbiol. 2023 Feb;25(2):229-240. doi: 10.1111/1462-2920.16303. Epub 2022 Dec 12. Environ Microbiol. 2023. PMID: 36482161 Free PMC article. Review.
-
Predatory protists play predominant roles in suppressing soil-borne fungal pathogens under organic fertilization regimes.Sci Total Environ. 2023 Mar 10;863:160986. doi: 10.1016/j.scitotenv.2022.160986. Epub 2022 Dec 16. Sci Total Environ. 2023. PMID: 36528948
-
Protists as main indicators and determinants of plant performance.Microbiome. 2021 Mar 20;9(1):64. doi: 10.1186/s40168-021-01025-w. Microbiome. 2021. PMID: 33743825 Free PMC article.
-
Plant-Driven Assembly of Disease-Suppressive Soil Microbiomes.Annu Rev Phytopathol. 2024 Sep;62(1):1-30. doi: 10.1146/annurev-phyto-021622-100127. Epub 2024 Aug 22. Annu Rev Phytopathol. 2024. PMID: 38857541 Review.
Cited by
-
Adaptation of rhizobacterial and endophytic communities in Citrus Grandis Exocarpium to long-term organic and chemical fertilization.Front Microbiol. 2024 Oct 21;15:1461821. doi: 10.3389/fmicb.2024.1461821. eCollection 2024. Front Microbiol. 2024. PMID: 39498128 Free PMC article.
-
Predatory protists reduce bacteria wilt disease incidence in tomato plants.Nat Commun. 2024 Jan 27;15(1):829. doi: 10.1038/s41467-024-45150-0. Nat Commun. 2024. PMID: 38280866 Free PMC article.
-
Phosphorus Fertilization Boosts Mineral-Associated Soil Organic Carbon Formation Associated with Phagotrophic Protists.Microb Ecol. 2023 Nov;86(4):2541-2551. doi: 10.1007/s00248-023-02258-y. Epub 2023 Jul 4. Microb Ecol. 2023. PMID: 37401933
-
Straw from Different Crop Species Recruits Different Communities of Lignocellulose-Degrading Microorganisms in Black Soil.Microorganisms. 2024 May 5;12(5):938. doi: 10.3390/microorganisms12050938. Microorganisms. 2024. PMID: 38792768 Free PMC article.
-
Plant associated protists-Untapped promising candidates for agrifood tools.Environ Microbiol. 2023 Feb;25(2):229-240. doi: 10.1111/1462-2920.16303. Epub 2022 Dec 12. Environ Microbiol. 2023. PMID: 36482161 Free PMC article. Review.
References
-
- Carvalho FP. Pesticides, environment, and food safety. Food Energy Secur. 2017;6:48–60. doi: 10.1002/fes3.108. - DOI
-
- Santos VB, Araújo ASF, Leite LFC, Nunes LAPL, Melo WJ. Soil microbial biomass and organic matter fractions during transition from conventional to organic farming systems. Geoderma. 2012;170:227–31. doi: 10.1016/j.geoderma.2011.11.007. - DOI
Publication types
MeSH terms
Substances
Grants and funding
- 42090065/National Natural Science Foundation of China (National Science Foundation of China)
- 32102475/National Natural Science Foundation of China (National Science Foundation of China)
- 2021TQ0156/China Postdoctoral Science Foundation
- 31972509/National Natural Science Foundation of China
- 41867006/National Natural Science Foundation of China
LinkOut - more resources
Full Text Sources
Other Literature Sources
Miscellaneous
