

S1P defects cause a new entity of cataract, alopecia, oral mucosal disorder, and psoriasis-like syndrome
- PMID: 35362222
- PMCID: PMC9081911
- DOI: 10.15252/emmm.202114904
S1P defects cause a new entity of cataract, alopecia, oral mucosal disorder, and psoriasis-like syndrome
Abstract
In this report, we discovered a new entity named cataract, alopecia, oral mucosal disorder, and psoriasis-like (CAOP) syndrome in two unrelated and ethnically diverse patients. Furthermore, patient 1 failed to respond to regular treatment. We found that CAOP syndrome was caused by an autosomal recessive defect in the mitochondrial membrane-bound transcription factor peptidase/site-1 protease (MBTPS1, S1P). Mitochondrial abnormalities were observed in patient 1 with CAOP syndrome. Furthermore, we found that S1P is a novel mitochondrial protein that forms a trimeric complex with ETFA/ETFB. S1P enhances ETFA/ETFB flavination and maintains its stability. Patient S1P variants destabilize ETFA/ETFB, impair mitochondrial respiration, decrease fatty acid β-oxidation activity, and shift mitochondrial oxidative phosphorylation (OXPHOS) to glycolysis. Mitochondrial dysfunction and inflammatory lesions in patient 1 were significantly ameliorated by riboflavin supplementation, which restored the stability of ETFA/ETFB. Our study discovered that mutations in MBTPS1 resulted in a new entity of CAOP syndrome and elucidated the mechanism of the mutations in the new disease.
Keywords: CAOP; MBTPS1; electron transfer flavoprotein; mitochondrial respiratory chain reaction.
© 2022 The Authors. Published under the terms of the CC BY 4.0 license.
Figures
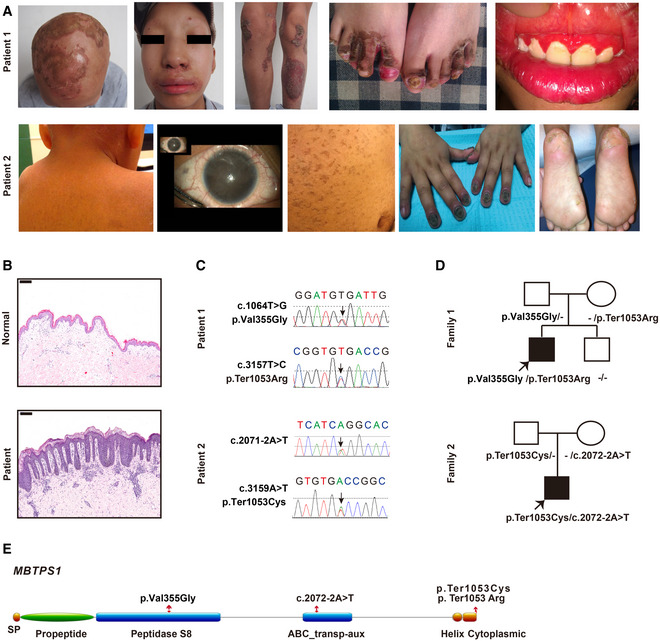
- A
Representative clinical picture of two patients with CAOP syndrome (14‐year‐old patient 1 and 5‐year‐old patient 2).
- B
Hematoxylin and eosin (H&E) staining of skin biopsies from patient 1 and healthy controls. Scale bars: 200 µm.
- C, D
Gene sequencing revealed heterozygous MBTPS1 p.Val355Gly (c.1064T>G) and p.Ter1053Arg (c.3157T>C) variants in patient 1 and heterozygous MBTPS1 p.Ter1053Cys (c.3159A>T) and c.2072‐2A>T variants in patient 2. The arrows indicate the variants.
- E
Schematic diagram of the S1P domain structure. The p.Val355Gly variant is localized in the peptidase S8 domain, the c.2072‐2A>T variant is located in the ABC transp‐aux domain, and p.Ter1053Arg and p.Ter1053Cys are found in the cytoplasmic domain.
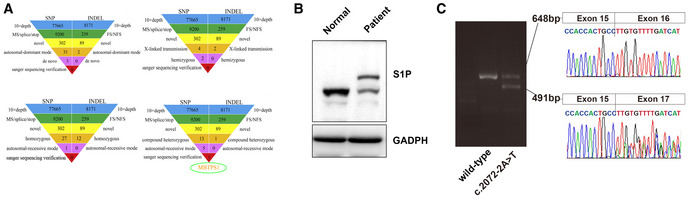
Whole‐exome sequencing analysis of patient 1. No meaningful new variants were detected based on the autosomal dominant pattern, X‐linked hemizygous genetic model, or autosomal recessive inheritance pattern. The analysis according to an autosomal recessive genetic mode detected compound heterozygous variants of the MBTPS1 gene.
Protein expression of S1P in skin biopsies of patient 1 and healthy controls. The heterozygous variants in the MBTPS1 gene resulted in two bands of S1P protein: one band was similar to the S1P band of the healthy control, and the other band was markedly larger than that of the healthy control.
Ethidium bromide‐stained agarose gel of the cDNA products resulting from the splicing assay of the wild‐type (WT) and variant (c.2072‐2A>T) pSPL3‐MBTPS1 minigenes. The 491‐base‐pair (bp) product represents the mutant RNA transcript lacking MBTPS1 exon 16, and the 648‐bp band corresponds to a wild‐type transcript that includes MBTPS1 exon 16. The identity of the PCR fragments was confirmed by sequencing.
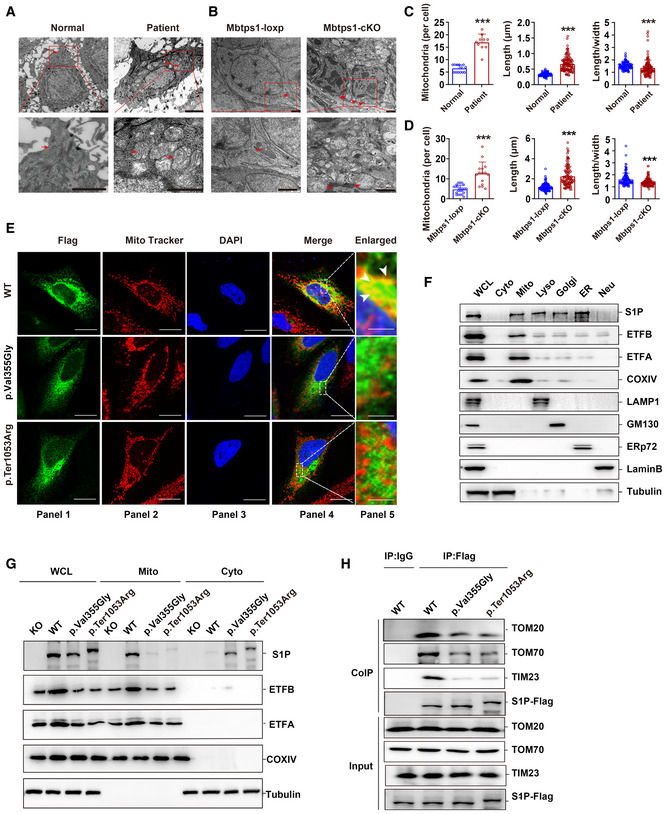
- A, B
Representative transmission electron microscopy (TEM) images showing keratinocyte mitochondria (red arrow) in patient 1 (A) and in the Mbtps1‐conditional knockout (cKO) mouse model (B). Scale bars: 2 µm.
- C, D
Quantification of the mitochondrial number and morphology in patient 1 (C) and the Mbtps1‐cKO mouse model (D). (C) Left panel: n = 13 biological replicates of normal individuals, n = 10 biological replicates of patient 1. Middle and right panel: n = 121 biological samples of normal individuals and patient 1. (D) Left panel: n = 23 biological replicates of Mbtps1‐loxP mice; n = 15 biological replicates of Mbtps1‐cKO mice. Middle panel and right panel: n = 113 biological replicates of Mbtps1‐loxP mice and Mbtps1‐cKO.
- E
Immunofluorescence experiments showed that mutant S1P (p.Val355Gly and p.Ter1053Arg) was diffusely localized in the cytosol and showed lower mitochondrial localization compared with wild‐type S1P, which suggested that these variants disrupt its mitochondrial import. The white arrowheads indicate the colocation (yellow) of S1P (green) and the mitochondrial tracer (red). Scale bars: 20 μm (panels 1–4); scale bars: 2 μm (panel 5).
- F
Cellular component separation assay showing that S1P was enriched in mitochondria. Biochemical fractionation of the whole‐cell lysate (WCL), cytosol (Cyto, tubulin), mitochondria (Mito, COX IV), lysosomes (Lyso, LAMP1), Golgi apparatus (Golgi, GM130), endoplasmic reticulum (ER, ERp72), and nucleus (Nue, Lamin B) from HaCaT cells.
- G
A component separation assay revealed a lower expression of mutant S1P (p.Val355Gly and p.Ter1053Arg) than wild‐type S1P in mitochondria.
- H
The impaired binding of mutant S1P (p.Val355Gly and p.Ter1053Arg) to translocase of the outer membrane (TOM) 70 and translocase of the inner membrane (TIM) 23 was detected by a coimmunoprecipitation (Co‐IP) assay.
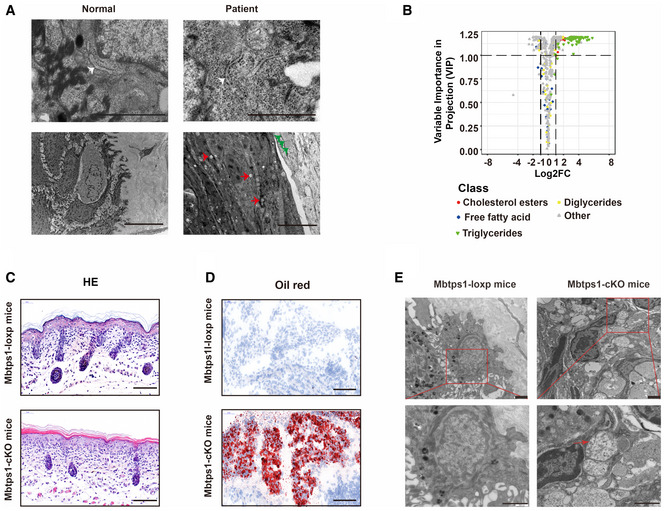
Deposited lipid vesicles (green arrowheads, lower panel) and increased amounts of lysosomes (red arrowheads, lower panel) were observed in patient 1, but no ER abnormalities were detected (white arrowheads, upper panel). Scale bars: 1 μm (upper panel) and 5 μm (lower panel).
Volcano plot showing abnormalities in cholesterol and triglyceride biosynthesis in MBTPS1‐knockout (MBTPS1‐KO) HaCaT cells. The fold changes were calculated as log2 (expression in MBTPS1‐KO/expression in MBTPS1‐Ctrl) (n = 4 biological replicates).
Hematoxylin and eosin (H&E) staining showed psoriasiform perivasculitis in Mbtps1‐conditional knockout (cKO) mice. Scale bars: 100 μm.
Oil red O staining showed lipid accumulation in Mbtps1‐cKO mice. Scale bar: 100 μm.
The encapsulation of mitochondria in lysosomes (red arrowhead) was observed in Mbtps1‐cKO mice. Scale bars: 2 μm.
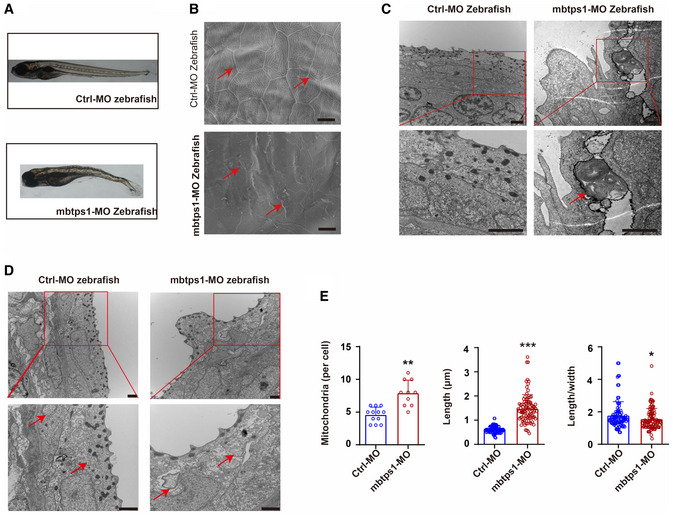
Mbtps1‐morpholino (MO) zebrafish exhibited obvious growth limitations and spinal curvature.
Skin abnormalities (red arrows) were observed in mbtps1‐MO zebrafish. Scale bars: 10 μm.
The encapsulation of mitochondria in lysosomes (red arrows) was observed in mbtps1‐MO zebrafish at 48 hpf. Scale bars: 2 μm.
Increases in the mitochondrial number and morphological alterations of mitochondria were observed in the mbtps1‐MO zebrafish model. Mitochondria were induced into multilamellar globules, and the folds of cristae in the inner membrane extended to onion‐like circles in the mbtps1‐MO zebrafish model (red arrows). Scale bars: 2 µm.
Quantification of the mitochondrial number and morphology in the zebrafish model. Left panel: Quantification of the mitochondrial number per cell in the zebrafish model (n = 12 biological replicates of control‐MO (Ctrl‐MO) zebrafish; n = 10 biological replicates of mbtps1‐MO zebrafish, biological replicates). Middle panel: Quantification of the mitochondrial length in the zebrafish model (n = 93 biological replicates). Right panel: Quantification of the length‐to‐width ratio of mitochondria in the zebrafish model (n = 93 biological replicates).
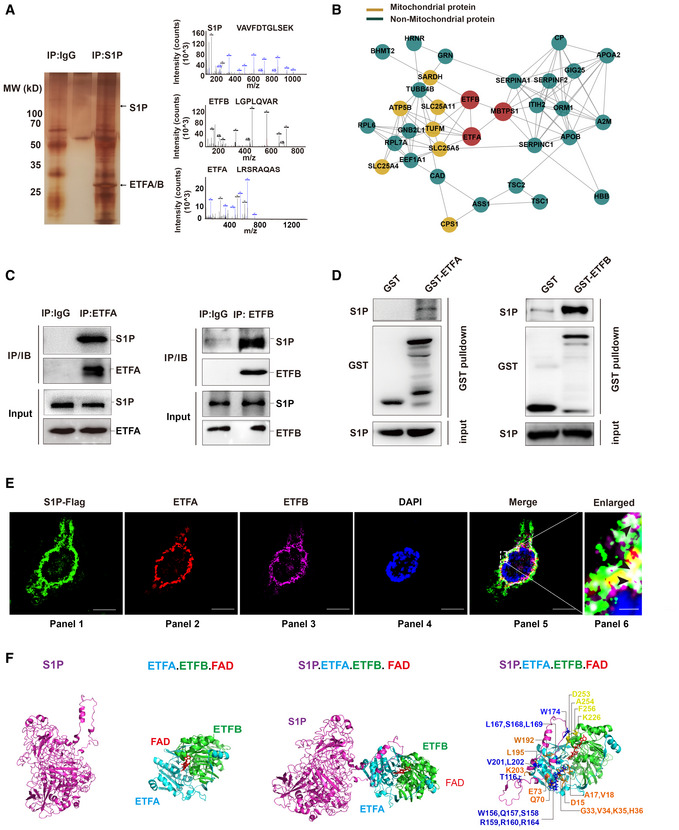
LC–MS/MS analysis of S1P‐binding proteins. Total protein lysate was subjected to coimmunoprecipitation (Co‐IP) with normal IgG or S1P antibody. The purified protein complex was separated by SDS–PAGE and then subjected to silver staining. The arrows indicate the bands containing S1P, ETFA, and ETFB. The differential bands were then analyzed by liquid chromatography‐tandem mass spectrometry (LC–MS/MS).
Role of the S1P‐ETFA‐ETFB interaction network in mitochondrial and nonmitochondrial protein systems.
S1P interacts with endogenous ETFA and ETFB in HaCaT cells. Total protein lysate was subjected to Co‐IP with normal IgG, ETFA (left panel), or ETFB (right panel) antibody. The interaction between S1P and ETFA/ETFB was then detected by immunoblotting.
The direct interaction between S1P and ETFA‐ETFB was validated by a GST pull‐down assay. Left panel: in vitro‐translated S1P was pulled down by purified GST‐ETFA fusion protein. Right panel: in vitro‐translated S1P was pulled down by purified GST‐ETFB fusion protein.
Confocal immunofluorescence demonstrated that S1P colocalized with ETFA and ETFB in HaCaT cells. The black arrowheads indicate the colocalization (white) of S1P (green), ETFA (red), and ETFB (purple). Scale bars: 20 μm (panels 1–5); scale bars: 2 μm (panel 6).
Three‐dimensional structure of the S1P‐ETFA‐ETFB‐FAD complex in stereo. The structures of S1P (magenta), ETFA (light blue), ETFB (green), and FAD (red) are depicted in carbon.
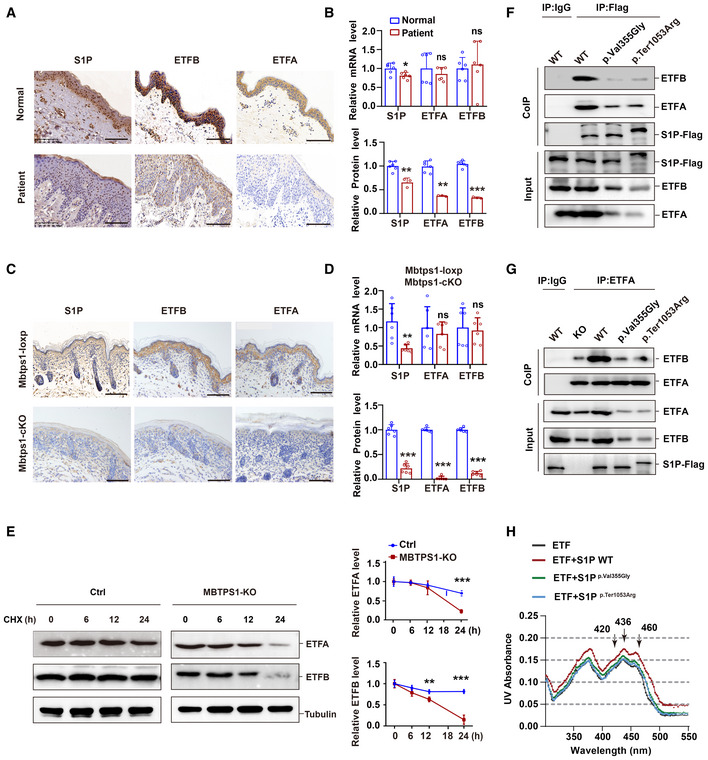
Representative immunohistochemical images of S1P, ETFA, and ETFB in normal controls and patient 1. Scale bars: 100 μm.
Unchanged mRNA levels and decreased protein levels of ETFA and ETFB were observed in the skin biopsy of patient 1. Quantitative RT–PCR analysis (upper panel, n = 6 biological replicates of normal controls; n = 6 technical replicates of patient 1) and immunohistochemistry (lower panel, n = 6 biological replicates; n = 3 technical replicates) of the S1P, ETFA, and ETFB levels.
Representative immunohistochemistry images of S1P, ETFA, and ETFB in both Mbtps1‐conditional knockout (cKO) and Mbtps1‐loxP mice. Scale bars: 100 μm.
MBTPS1 gene knockout led to decreases in the ETFA and ETFB protein levels in vivo. Quantitative RT–PCR analysis (upper panel, n = 6 biological replicates) and immunohistochemistry (lower panel, n = 6 biological replicates) of the S1P, ETFA, and ETFB levels in Mbtps1‐cKO mice and Mbtps1‐loxP mice.
Cycloheximide (CHX) chase analysis showed that MBTPS1 knockout induced rapid degradation of ETFA and ETFB proteins in HaCaT cells. Left panel: Representative western blotting images of the ETFA and ETFB protein levels during CHX chase. Right panel: Quantification of the immunoblotting results corresponding to the left panel (n = 3 biological replicates).
Mutant S1P (p.Val355Gly and p.Ter1053Arg) only weakly interacted with ETFA and ETFB. We constructed Flag‐tagged wild‐type and mutant S1P HaCaT cell lines and then performed a Co‐IP assay with Flag antibody, and the interaction between S1P and ETFA/ETFB was detected by immunoblotting.
Wild‐type S1P, but not mutant S1P (p.Val355Gly and p.Ter1053Arg), decreased the association between ETFA and ETFB. We performed a Co‐IP assay with an ETFA antibody, and the interaction between ETFA and ETFB was detected by immunoblotting.
Wild‐type S1P, but not mutant S1P (p.Val355Gly and p.Ter1053Arg), enhanced the incorporation of FAD into the ETF complex. The visible spectra of flavin show two shoulder peaks at 420 and 460 nm, indicating the incorporation of FAD in the ETF complex. In the presence of the wild‐type S1P protein, the two peaks were shifted by 0.02 OD units, whereas the additional mutant S1P (p.Val355Gly and p.Ter1053Arg) weakly shifted the two peaks by 0.005–0.01 OD units.
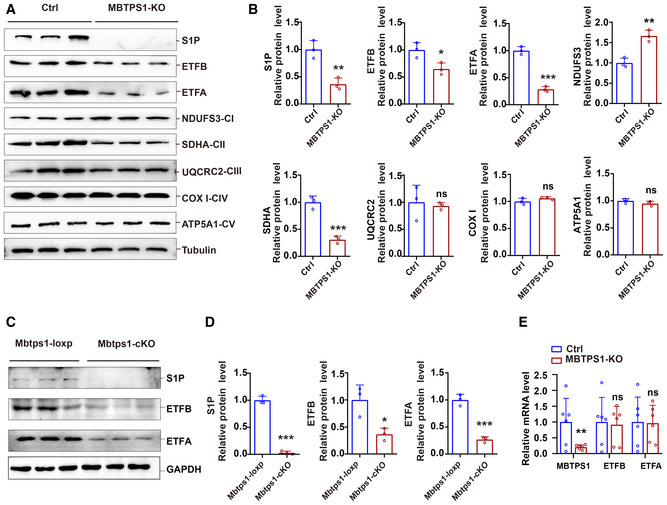
- A, B
S1P knockout decreased the levels of ETF and the complex II subunit SDHA and increased the protein levels of the complex I subunit NDUFS3 in HaCaT cells. A: Representative immunoblots of S1P, ETFA, ETFB, and mitochondrial electron transport chain proteins in control (Ctrl) and MBTPS1‐knockout (KO) HaCaT cells. B: Quantification of the immunoblotting results shown in (A) (n = 3 biological replicates).
- C, D
Loss of S1P led to a decrease in ETFA and ETFB proteins in vivo. C: Representative immunoblots of S1P, ETFA, and ETFB in Mbtps1‐cKO and Mbtps1‐loxP mice. D: Quantification of the immunoblotting results shown in (C) (n = 3 biological replicates).
- E
Loss of S1P did not affect the mRNA expression of ETFA and ETFB in HaCaT cells. Quantitative RT–PCR analysis of the S1P, ETFA, and ETFB mRNA levels in Ctrl and MBTPS1‐knockout (KO) HaCaT cells (n = 6 biological replicates).
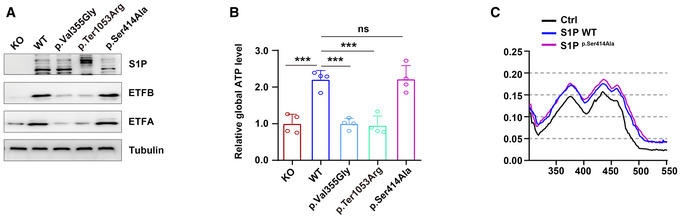
Both wild‐type and protease‐inactive mutant S1P (p.Ser414Ala) increased the ETFA and ETFB protein levels, indicating that S1P regulates ETF stability independent of its protease activity. Three biological replicates were included in this study.
S1P increased global ATP production independent of its protease activity (n = 4 biological replicates).
S1P enhanced the incorporation of FAD into the ETF complex independent of its protease activity.
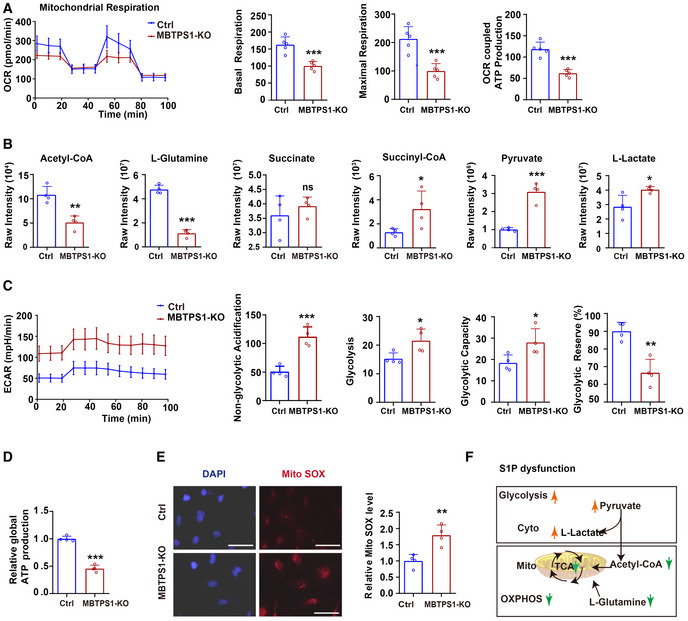
Mitochondrial respiration (OCR) in control (Ctrl) and MBTPS1‐knockout (KO) HaCaT cells were quantified in real time using a Seahorse extracellular flux analyzer. Right subpanels: Quantification of basal respiration, maximal respiration, and OCR‐coupled ATP production in mitochondrial respiration (n = 5 biological replicates).
Quantification of relevant metabolites in mitochondrial oxidative phosphorylation (OXPHOS) and glycolysis in Ctrl and MBTPS1‐KO HaCaT cells (n = 4 biological replicates).
Nonmitochondrial respiration (ECAR) was quantified in real time using a Seahorse extracellular flux analyzer. Quantification of non‐glycolytic acidification, glycolysis, glycolytic capacity, and glycolytic reserve in Ctrl and MBTPS1‐KO HaCaT cells (n = 4 biological replicates).
MBTPS1 knockout led to a decrease in global ATP production in HaCaT cells. Control and MBTPS1‐KO HaCaT cells were cultured in six‐well dishes. A standard curve was generated to calculate the sample ATP concentrations using an ATP Lite Luminescence Assay kit (n = 4 biological replicates).
MBTPS1 knockout significantly increased the generation of mitochondrial reactive oxygen species (Mito SOX) in HaCaT cells. Left panel: Representative immunofluorescence images of Mito SOX in HaCaT cells. Scale bars: 100 µm. Right panel: The immunofluorescence intensity was quantified to calculate the relative Mito ROS level in HaCaT cells (n = 4 biological replicates).
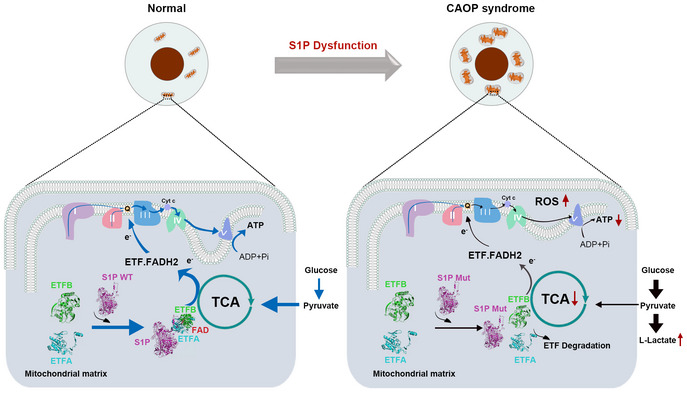
Schematic representation of OXPHOS and glycolysis upon S1P dysfunction.
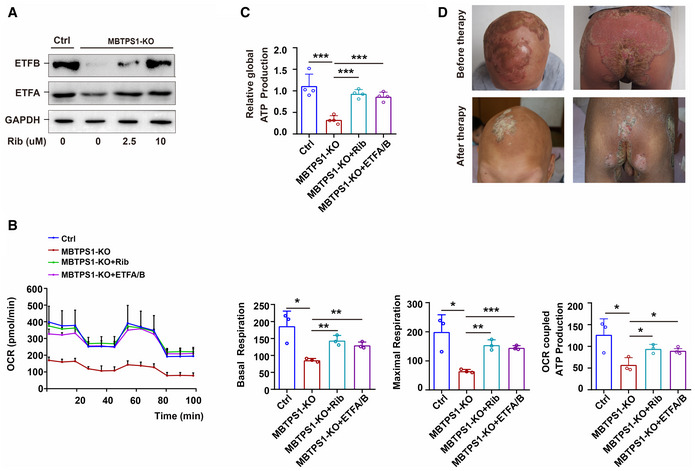
The S1P deficiency‐induced decrease in ETFA and ETFB was significantly reversed by riboflavin (Rib) in a concentration‐dependent manner in MBTPS1‐KO HaCaT cells. GAPDH was used as a loading control. MBTPS1‐KO cells were initially cultured in DMEM for 24 h and supplemented with 0, 2.5, 5, or 10 µM riboflavin for 3 days. The expression of ETFA and ETFB was then detected by immunoblotting.
The S1P deficiency‐induced abnormalities in mitochondrial respiration can be significantly reversed by riboflavin supplementation and ETFA/B overexpression in HaCaT cells. Left panel: Mitochondrial respiration (OCR) was quantified in real time using a Seahorse extracellular flux analyzer. Right panel: Quantification of nonglycolytic acidification, glycolysis, glycolytic capacity, and glycolytic reserve in HaCaT cells (n = 3 biological replicates).
The decreased global ATP production caused by S1P deficiency could be significantly reversed by riboflavin supplementation and ETFA/B overexpression in HaCaT cells (n = 4 biological replicates).
Inflammatory lesions in CAOP syndrome were significantly improved by riboflavin supplementation. The representative head image of patient 1 before therapy is shown in Fig 1A (panel 1).
Similar articles
-
Coenzyme Q10 serves to couple mitochondrial oxidative phosphorylation and fatty acid β-oxidation, and attenuates NLRP3 inflammasome activation.Free Radic Res. 2018 Dec;52(11-12):1445-1455. doi: 10.1080/10715762.2018.1500695. Epub 2018 Sep 11. Free Radic Res. 2018. PMID: 30003820
-
Riboflavin in Neurological Diseases: A Narrative Review.Clin Drug Investig. 2021 Jun;41(6):513-527. doi: 10.1007/s40261-021-01038-1. Epub 2021 Apr 22. Clin Drug Investig. 2021. PMID: 33886098 Review.
-
Novel mutations in ETFDH gene in Chinese patients with riboflavin-responsive multiple acyl-CoA dehydrogenase deficiency.Clin Chim Acta. 2009 Jun 27;404(2):95-9. doi: 10.1016/j.cca.2009.02.015. Epub 2009 Mar 3. Clin Chim Acta. 2009. PMID: 19265687
-
Electron transfer flavoprotein and its role in mitochondrial energy metabolism in health and disease.Gene. 2021 Apr 15;776:145407. doi: 10.1016/j.gene.2021.145407. Epub 2021 Jan 13. Gene. 2021. PMID: 33450351 Free PMC article. Review.
-
Molecular and Clinical Investigations on Portuguese Patients with Multiple acyl-CoA Dehydrogenase Deficiency.Curr Mol Med. 2019;19(7):487-493. doi: 10.2174/1566524019666190507114748. Curr Mol Med. 2019. PMID: 31418342
Cited by
-
Case Report: Recombinant human growth hormone therapy in a patient with spondyloepiphyseal dysplasia, Kondo-Fu type.Front Pediatr. 2023 Feb 3;11:1068718. doi: 10.3389/fped.2023.1068718. eCollection 2023. Front Pediatr. 2023. PMID: 36816387 Free PMC article.
-
ADAM17 variant causes hair loss via ubiquitin ligase TRIM47-mediated degradation.JCI Insight. 2024 May 21;9(13):e177588. doi: 10.1172/jci.insight.177588. JCI Insight. 2024. PMID: 38771644 Free PMC article.
-
Clinical and molecular characterization of a patient with MBTPS1 related spondyloepiphyseal dysplasia: Evidence of pathogenicity for a synonymous variant.Front Pediatr. 2023 Jan 11;10:1056141. doi: 10.3389/fped.2022.1056141. eCollection 2022. Front Pediatr. 2023. PMID: 36714646 Free PMC article.
-
Association of autoimmune and allergic diseases with senile cataract: a bidirectional two-sample Mendelian randomization study.Front Immunol. 2024 Mar 22;15:1325868. doi: 10.3389/fimmu.2024.1325868. eCollection 2024. Front Immunol. 2024. PMID: 38585265 Free PMC article.
-
HMGA1 promotes the progression of esophageal squamous cell carcinoma by elevating TKT-mediated upregulation of pentose phosphate pathway.Cell Death Dis. 2024 Jul 30;15(7):541. doi: 10.1038/s41419-024-06933-x. Cell Death Dis. 2024. PMID: 39080260 Free PMC article.
References
-
- Balasubramaniam S, Christodoulou J, Rahman S (2019) Disorders of riboflavin metabolism. J Inherit Metab Dis 42: 608–619 - PubMed
-
- Barthelemy H, Chouvet B, Cambazard F (1986) Skin and mucosal manifestations in vitamin deficiency. J Am Acad Dermatol 15: 1263–1274 - PubMed
-
- Baum H, Michaelree J, Brown EJS (1942) The quantitative relationship of riboflavin to cataract formation in rats. Science 95: 24–25 - PubMed
-
- Bykov YS, Rapaport D, Herrmann JM, Schuldiner M (2020) Cytosolic events in the biogenesis of mitochondrial proteins. Trends Biochem Sci 45: 650–667 - PubMed
Publication types
MeSH terms
Substances
LinkOut - more resources
Full Text Sources
Medical
Molecular Biology Databases
Miscellaneous
