. 2021 May 28;12(1):3225.
doi: 10.1038/s41467-021-23502-4.

Integrating genomics and metabolomics for scalable non-ribosomal peptide discovery

Affiliations

Integrating genomics and metabolomics for scalable non-ribosomal peptide discovery

Bahar Behsaz et al. Nat Commun. .

Erratum in

Abstract

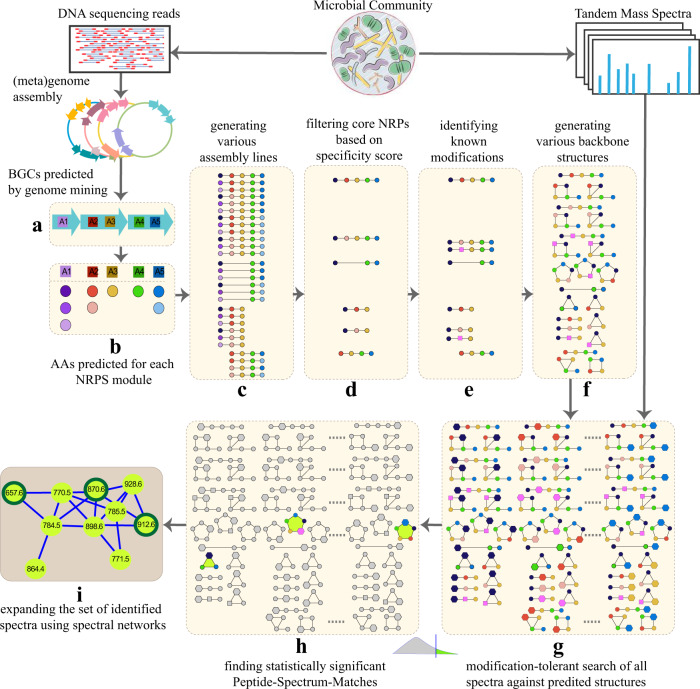
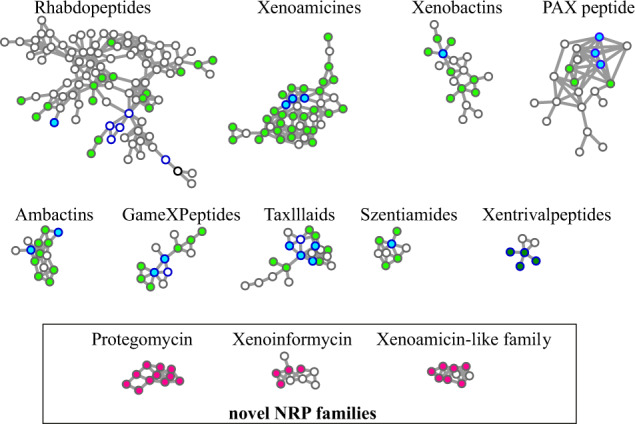
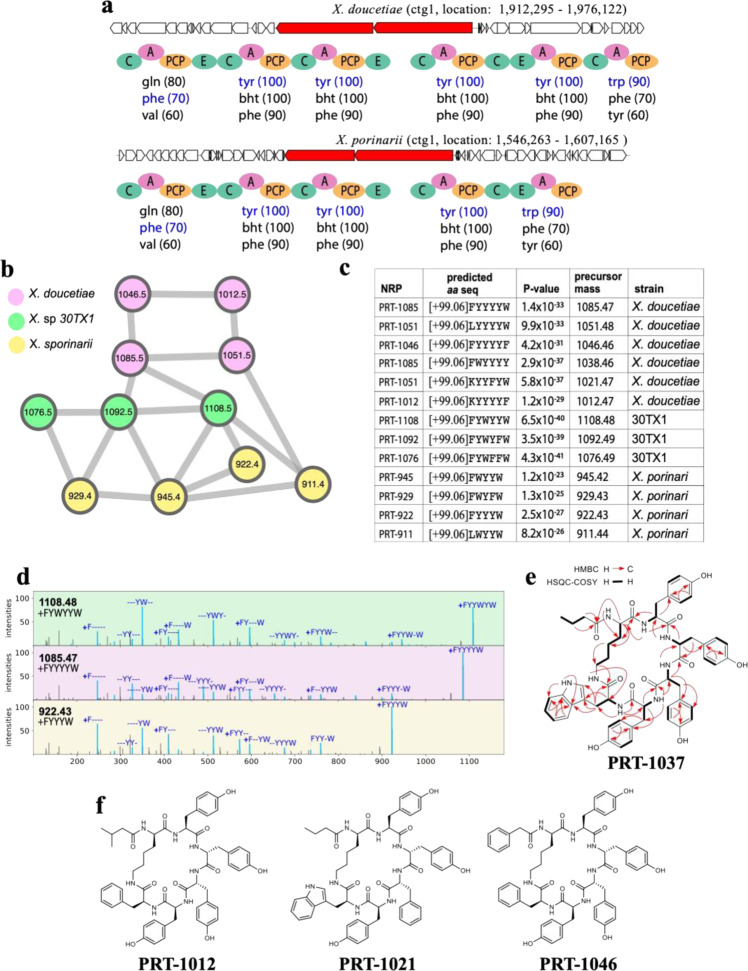
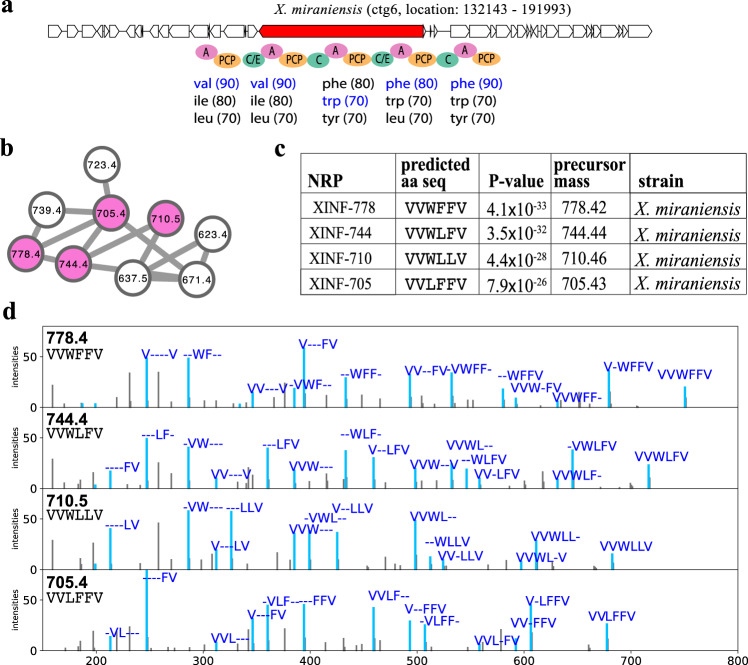
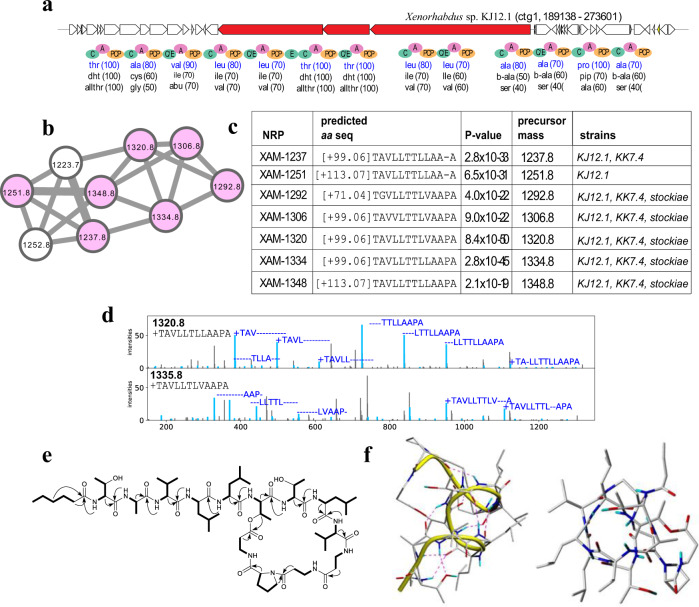
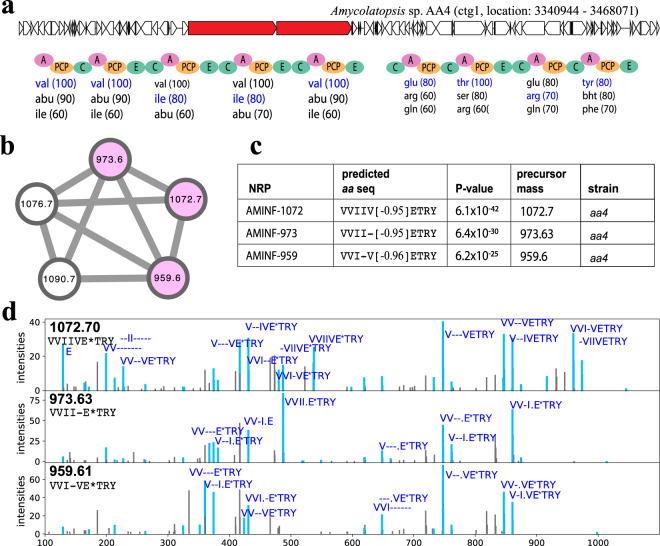
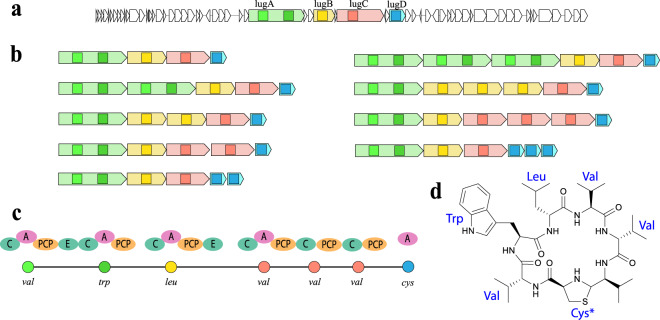
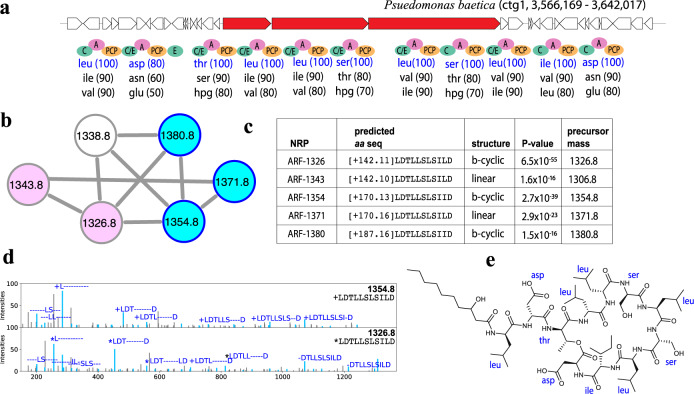
Non-Ribosomal Peptides (NRPs) represent a biomedically important class of natural products that include a multitude of antibiotics and other clinically used drugs. NRPs are not directly encoded in the genome but are instead produced by metabolic pathways encoded by biosynthetic gene clusters (BGCs). Since the existing genome mining tools predict many putative NRPs synthesized by a given BGC, it remains unclear which of these putative NRPs are correct and how to identify post-assembly modifications of amino acids in these NRPs in a blind mode, without knowing which modifications exist in the sample. To address this challenge, here we report NRPminer, a modification-tolerant tool for NRP discovery from large (meta)genomic and mass spectrometry datasets. We show that NRPminer is able to identify many NRPs from different environments, including four previously unreported NRP families from soil-associated microbes and NRPs from human microbiota. Furthermore, in this work we demonstrate the anti-parasitic activities and the structure of two of these NRP families using direct bioactivity screening and nuclear magnetic resonance spectrometry, illustrating the power of NRPminer for discovering bioactive NRPs.


Conflict of interest statement

P.A.P. is a co-founder, has an equity interest and receives income from Digital Proteomics, LLC. The terms of this arrangement have been reviewed and approved by the University of California, San Diego in accordance with its conflict of interest policies. B.B. and H.M. are co-founders and have equity interests from Chemia.ai, LLC. The remaining authors declare no competing interests.

Figures

Fig. 1
Fig. 1. NRPminer pipeline.
a Predicting NRPS BGCs using antiSMASH. Each ORF is represented by an arrow, and each A-domain is represented by a square, b predicting putative amino acids for each NRP residue using NRPSpredictor2 (ref. ), colored circles represents different amino acids (AAs), c generating multiple assembly lines by considering various combinations of ORFs and generating all putative core NRPs for each assembly line in the identified BGC (for brevity only assembly lines generated by deleting a single NRPS unit are shown; in practice, NRPminer considers loss of up to two NRPS units, as well as single and double duplication of each NRPS unit), d filtering the core NRPs based on their specificity scores, e identifying domains corresponding to known modifications and incorporating them in the selected core NRPs (modified amino acids are represented by purple squares), f generating linear, cyclic and branch-cyclic backbone structures for each core NRP, g generating a set of high-scoring PSMs using modification-tolerant VarQuest search of spectra against the database of the constructed putative NRP structures. NRPminer considers all possible mature NRPs with up to one PAM (shown as hexagons) in each NRP structure. For brevity some of the structures are not shown. h Computing statistical significance of PSMs and reporting the significant PSMs, and i expanding the set of identified spectra using spectral networks. Nodes in the spectral network represent spectra and edges connect “similar” spectra (see “Methods”).
Fig. 2
Fig. 2. Spectral networks for nine known and three previously unreported NRP families identified by NRPminer in the XPF dataset.
Each node represents a spectrum. The spectra of known NRPs (as identified by spectral library search against the library of all known compounds in GNPS) are shown with a dark blue border. A node is colored if the corresponding spectrum forms a statistically significant PSM and not colored otherwise. We distinguish between identified spectra of known NRPs with known BGCs (colored by light blue) and identified spectra of known NRPs (from xentrivalpeptide family) with previously unknown BGC (colored by dark green). Identified spectra of previously unreported NRPs from known NRP families (previously unreported NRP variants) are colored in light green. Identified spectra of NRPs from previously unreported NRP families are colored in magenta. Proteogomycins and xenoinformycin subnetworks represent previously unreported NRP families. The Xenoamicin-like subnetwork revealed a BGC family distantly related to xenoamicins (6 out 13 amino acids are identical). For simplicity only spectra at charge state +1 are used for the analysis.
Fig. 3
Fig. 3. Identifying protegomycin (PRT) NRP family.
a The BGCs generating the NRP in X. doucetiae (top) and X. porinarii (bottom) along with NRPS genes (shown in red) and A-, C-, PCP-, and E-domains in these NRPSs. The rest of the genes in the corresponding contigs is shown in white. No BGC was found in Xenorhabdus sp. 30TX1. Three highest-scoring amino acids for each A-domain in these BGCs (according to NRPSpredictor2 (ref. ) predictions) are shown below the corresponding A-domains. Amino acids appearing in the NRPs [+99.06]FYYYYW and [+99.06]FYYYW identified by NRPminer (with the lowest p value) are shown in blue. b Spectral network formed by the spectra that originate from NRPs in the protegomycin family. c Sequences of the identified NRPs in the protegomycin family (with the lowest p value among all spectra originating from the same NRP). PRT represents protegomycin. For MS details see Supplementary Table 3. The p values are computed based on MCMC approach using MS-DPR with 10,000 simulations. d For each strain, an annotated spectrum representing the lowest p value is shown. The spectra were annotated based on predicted NRPs [+99.06]FYYWYW, [+99.06]FYYYYW, and [+99.06]FYYYW from top to bottom. The “+” sign represents the addition of [+99.06 Da]. Colors in parts b and d are coordinated. Supplementary Figures 6–8 show the annotated spectra for all NRPs shown in part (c). e Key HMBC and HSQC-COSY correlations in PRT-1037. f Structures for selected PRT derivatives produced by X. doucetiae including amino acid configuration as concluded from the presence of epimerization domains in the corresponding NRPSs and acyl residues as concluded from feeding experiments (Supplementary Fig. 9). Predicted structures for all identified PRT derivatives from X. doucetiae, X. poinarii, and 30TX1 are shown in Supplementary Figs. 10 and S11.
Fig. 4
Fig. 4. Identifying xenoinformycin (XINF) NRP family.
a The BGC generating the NRP in X. miraniensis along with NRPS genes (shown in red) and the A-, C-, PCP-, and C/E-domains appearing on the corresponding NRPS. The rest of the genes in the corresponding contigs are shown in white. Three highest-scoring amino acids for each A-domain in this BGC (according to NRPSpredictor2 (ref. ) predictions) are shown below the corresponding A-domains. Amino acids appearing in the NRP VVWFF identified by NRPminer (with the lowest p value) are shown in blue. b Spectral network formed by the spectra that originate from NRPs in the xenoinformycin family. A node is colored if the corresponding spectrum forms a statistically significant PSM (with p value threshold 10−15) and not colored otherwise. c Sequences of the identified NRPs in the xenoinformycin family (with the lowest p value among all spectra originating from the same NRP). XINF represents xenoinformycin. The p values are computed based on MCMC approach using MS-DPR with 10,000 simulations. d For each identified NRP, an annotated spectrum forming a PSM with the lowest p value is shown.
Fig. 5
Fig. 5. Identifying xenoamicin-like (XAM) NRP family.
a The BGCs generating the NRP in Xenorhabdus sp. KJ12 along with NRPS genes (shown in red) and A-, C-, PCP-, and E-domains in these NRPSs. The rest of the genes in the corresponding contigs are shown in white. Three highest-scoring amino acids for each A-domain in these BGCs (according to NRPSpredictor2 (ref. ) predictions) are shown below the corresponding A-domains. Amino acids appearing in the NRP [+99.06]TAVLLTTLLAAPA identified by NRPminer (with the lowest p value) are shown in blue. b Spectral network formed by the spectra that originate from NRPs in the XAM family. c Sequences of the identified NRPs in this family (with the lowest p value among all spectra originating from the same NRP). The p values are computed based on MCMC approach using MS-DPR with 10,000 simulations. d For each strain, an annotated spectrum representing the lowest p value is shown. The spectra were annotated based on predicted NRPs [+99.06]TAVLLTTLLAAPA and [+99.06] TAVLLTTLVAAPA from top to bottom. The “+” sign represents the addition of [+99.06]. Supplementary Figures 23 and S24 show the annotated spectra for the other NRPs shown in part (c). e NMR-based correlations of XAM-1320 (m/z 1320.8 [M+H]+) produced by Xenorhabdus KJ12.1 (Supplementary Table 5 and Supplementary Figs. 25–29). HSQC-TOCSY (bold lines) and key ROESY correlations (arrows) are shown. f 3D structure of XAM-1320 derived from 121 ROE-derived distance constraints (Supplementary Table 6), molecular dynamics, and energy minimization. Peptide backbone is visualized with a yellow bar (left). Predicted hydrogen bonds stabilizing the β-helix are shown as dashed lines. View from above at the pore formed by XAM-1320 (right). NRPminer identified this NRP with p value 8.4 × 10−50.
Fig. 6
Fig. 6. Identifying aminformatide (AMINF) NRP family discovered by NRPminer in the SoilActi dataset.
a The BGC generating the core NRP in Amycolatopsis sp. AA4 along with NRPS genes (shown in red) and the A-, C-, PCP, and E-domains appearing in the corresponding NRPS. The rest of the genes in the corresponding contigs are shown in white. Three highest-scoring amino acids for each A-domain in this BGC (according to NRPSpredictor2 (ref. ) predictions) are shown below the corresponding A-domains. Amino acids appearing in the NRP VVIVETRY identified by NRPminer (with the lowest p value) are shown in blue. b Spectral network formed by spectra that originate from the AMINF NRPs. A node is colored if the corresponding spectrum forms a statistically significant PSM and not colored otherwise. The p values are computed based on MCMC approach using MS-DPR with 10,000 simulations. c Sequences of the NRPs identified by NRPminer in the aminformatide family (with the lowest p value among all PSMs originating from the same NRP). NRPminer predicted a PAM with loss of ~0.96 Da on E, represented by E*. AMINF represents aminformatide. d For each identified NRP, an annotated spectrum representing the lowest p value is shown.
Fig. 7
Fig. 7. Lugdunin BGC and the assembly lines formed by NRPminer using the OrfDup option.
a Lugdunin BGC with the four ORFs shown in different colors. The squares represent the A-domains. b Assembly lines formed by duplication of a single NRPS subunit (corresponding to each ORF) zero, one, and two times are pictured. NRPminer explores all assembly lines generated by duplicating each ORF up to two times when the “OrfDup” option is selected. c The NRPS assembly lined (with A-, C-, PCP-, and E-domains pictured) appearing in the NRPS that synthesizes lugdunin, where one Val-specific A-domain loads three amino acids (valines) to the growing peptide. Amino acids corresponding to lugdunin structure are shown below each A-domain. Circles represent amino acids (different amino acids are shown by different colors). d Cyclic structure of lugdunin with the amino acids highlighted in blue. The “Cys*” represent Cys-derived thiazolidine in lugdunin structure.
Fig. 8
Fig. 8. Arthrofactin (ARF) NRP family.
a The BGCs generating the NRP in Pseudomonas baetica sp. 04-6(1) along with the NRPS genes (shown in red) and A-, C-, C/E-, PCP-, and E-domains in these NRPSs. The rest of the genes in the corresponding contigs are shown in white. Three highest-scoring amino acids for each A-domain in these BGCs (according to NRPSpredictor2 (ref. ) predictions) are shown below the corresponding A-domains. Amino acids appearing in the known NRP ARF-1354 with amino acid sequence [+170.13]LDTLLSLSILD are shown in blue. b Spectral network formed by the spectra that originate from NRPs in the ARF family. The known arthrofactins are shown in blue, while the purples nodes represent the previously unreported variants identified by NRPminer. All identified athrofactins share the same core NRP LDTLLSLSILD. c Sequences of the identified NRPs in this family (with the lowest p value among all spectra originating from the same NRP). Column “structure” shows if the predicted structure for the identified NRPs is linear or branch-cyclic (shown by b-cyclic). The p values are computed based on MCMC approach using MS-DPR with 10,000 simulations. d Two annotated spectra representing the PSMs (with the lowest p values among spectra originating from the same NRPs) corresponding to ARF-1354 and 1326. The two spectra were annotated based on predicted NRPs [+170.13]LDTLLSLSILD (PSM p value 2.7 × 10−39) and [+142.11]LDTLLSLSILD (PSM p value 6.5 × 10−55), from top to bottom. The “+” and “*” signs represent the addition of [+170.13] and [+142.11], respectively. e The 2D structure of known arthrofactin ARF-1354 (ref. ). NRPminer identified this NRP with p value 2.7 × 10−39.

Similar articles

Cited by

References

    1. Newman DJ, Cragg GM. Natural products as sources of new drugs from 1981 to 2014. J. Nat. Prod. 2016;79:629–661. - PubMed
    1. Li JWH, Vederas JC. Drug discovery and natural products: end of an era or an endless frontier? Science. 2009;325:161–165. - PubMed
    1. Ling LL, et al. A new antibiotic kills pathogens without detectable resistance. Nature. 2015;517:455–459. - PMC - PubMed
    1. Harvey AL, Edrada-Ebel R, Quinn RJ. The re-emergence of natural products for drug discovery in the genomics era. Nat. Rev. Drug Discov. 2015;14:111–129. - PubMed
    1. Wang H, Fewer DP, Holm L, Rouhiainen L, Sivonen K. Atlas of nonribosomal peptide and polyketide biosynthetic pathways reveals common occurrence of nonmodular enzymes. Proc. Natl Acad. Sci. USA. 2014;111:9259–9264. - PMC - PubMed

Publication types

MeSH terms