

A Pseudomonas aeruginosa Antimicrobial Affects the Biogeography but Not Fitness of Staphylococcus aureus during Coculture
- PMID: 33785630
- PMCID: PMC8092195
- DOI: 10.1128/mBio.00047-21
A Pseudomonas aeruginosa Antimicrobial Affects the Biogeography but Not Fitness of Staphylococcus aureus during Coculture
Abstract
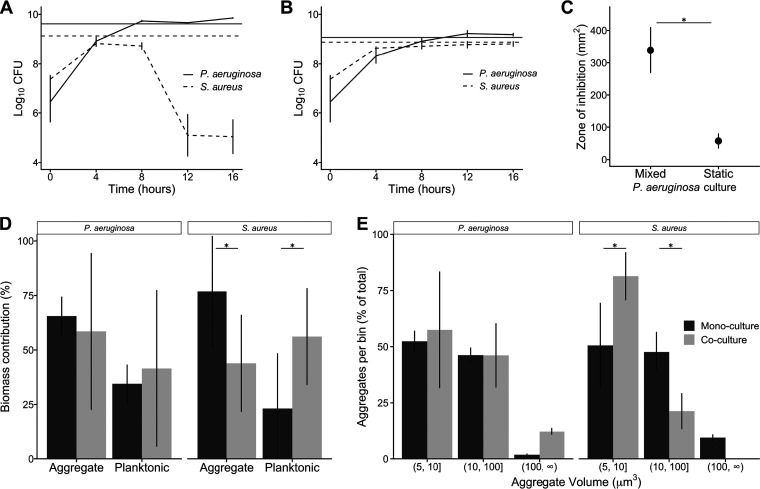
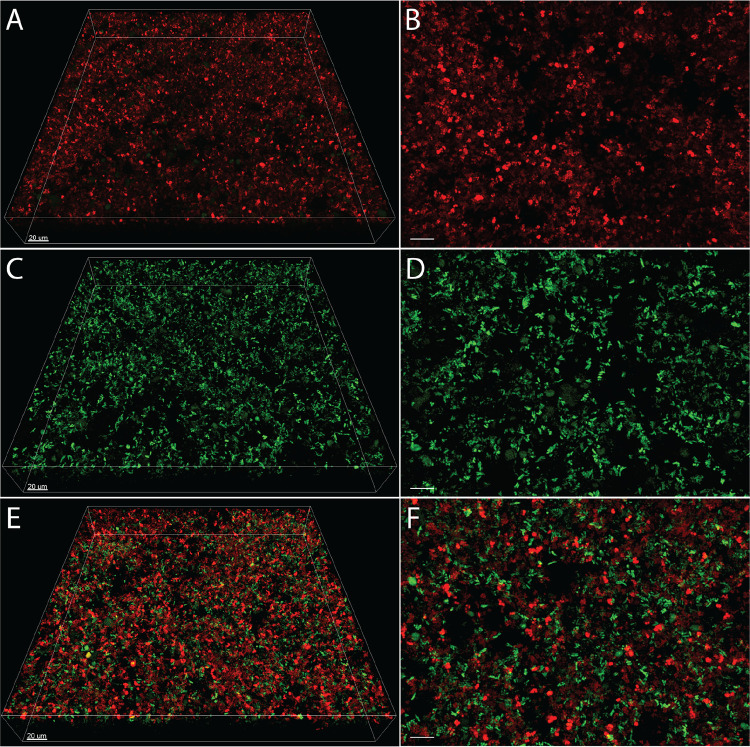
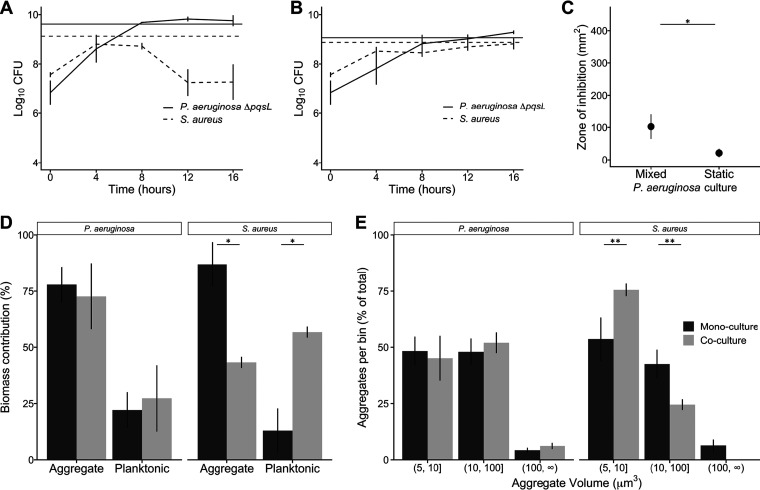
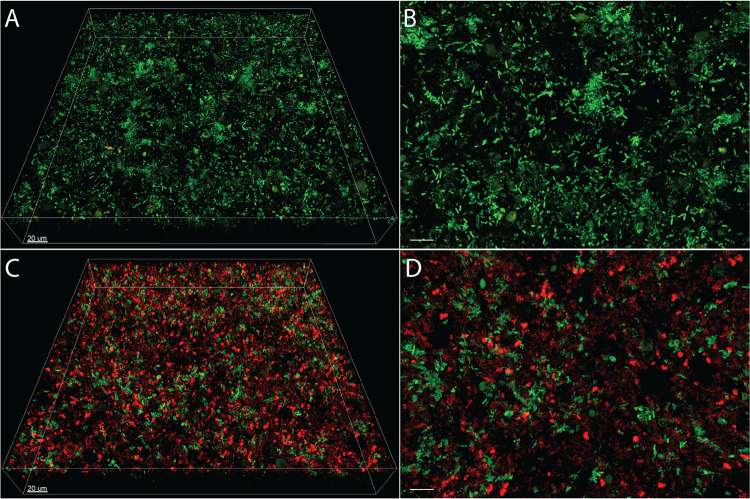
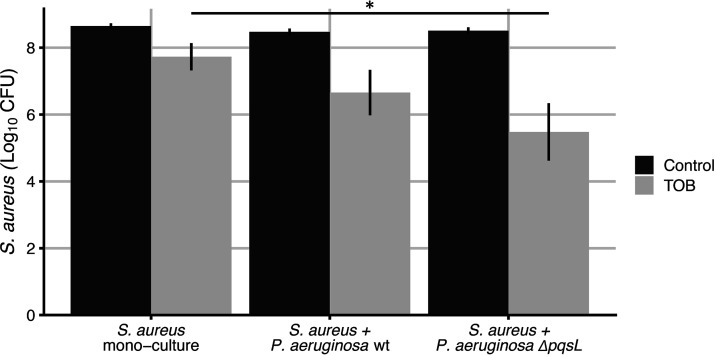
Pseudomonas aeruginosa and Staphylococcus aureus are two of the most common coinfecting bacteria in human infections, including the cystic fibrosis (CF) lung. There is emerging evidence that coinfection with these microbes enhances disease severity and antimicrobial tolerance through direct interactions. However, one of the challenges to studying microbial interactions relevant to human infection is the lack of experimental models with the versatility to investigate complex interaction dynamics while maintaining biological relevance. Here, we developed a model based on an in vitro medium that mimics human CF lung secretions (synthetic CF sputum medium [SCFM2]) and allows time-resolved assessment of fitness and community spatial structure at the micrometer scale. Our results reveal that P. aeruginosa and S. aureus coexist as spatially structured communities in SCFM2 under static growth conditions, with S. aureus enriched at a distance of 3.5 μm from P. aeruginosa Multispecies aggregates were rare, and aggregate (biofilm) sizes resembled those in human CF sputum. Elimination of P. aeruginosa's ability to produce the antistaphylococcal small molecule HQNO (2-heptyl-4-hydroxyquinoline N-oxide) had no effect on bacterial fitness but altered the spatial structure of the community by increasing the distance of S. aureus from P. aeruginosa to 7.6 μm. Lastly, we show that coculture with P. aeruginosa sensitizes S. aureus to killing by the antibiotic tobramycin compared to monoculture growth despite HQNO enhancing tolerance during coculture. Our findings reveal that SCFM2 is a powerful model for studying P. aeruginosa and S. aureus and that HQNO alters S. aureus biogeography and antibiotic susceptibility without affecting fitness.IMPORTANCE Many human infections result from the action of multispecies bacterial communities. Within these communities, bacteria have been proposed to directly interact via physical and chemical means, resulting in increased disease and antimicrobial tolerance. One of the challenges to studying multispecies infections is the lack of robust, infection-relevant model systems with the ability to study these interactions through time with micrometer-scale precision. Here, we developed a versatile in vitro model for studying the interactions between Pseudomonas aeruginosa and Staphylococcus aureus, two bacteria that commonly coexist in human infections. Using this model along with high-resolution, single-cell microscopy, we showed that P. aeruginosa and S. aureus form communities that are spatially structured at the micrometer scale, controlled in part by the production of an antimicrobial by P. aeruginosa In addition, we provide evidence that this antimicrobial enhances S. aureus tolerance to an aminoglycoside antibiotic only during coculture.
Keywords: HQNO; Pseudomonas aeruginosa; SCFM2; Staphylococcus aureus; biogeography; coculture; cystic fibrosis; model; model system; spatial structure.
Copyright © 2021 Barraza and Whiteley.
Figures

Similar articles
-
Pseudomonas aeruginosa Alters Staphylococcus aureus Sensitivity to Vancomycin in a Biofilm Model of Cystic Fibrosis Infection.mBio. 2017 Jul 18;8(4):e00873-17. doi: 10.1128/mBio.00873-17. mBio. 2017. PMID: 28720732 Free PMC article.
-
Pseudomonas aeruginosa Alginate Overproduction Promotes Coexistence with Staphylococcus aureus in a Model of Cystic Fibrosis Respiratory Infection.mBio. 2017 Mar 21;8(2):e00186-17. doi: 10.1128/mBio.00186-17. mBio. 2017. PMID: 28325763 Free PMC article.
-
Exogenous Alginate Protects Staphylococcus aureus from Killing by Pseudomonas aeruginosa.J Bacteriol. 2020 Mar 26;202(8):e00559-19. doi: 10.1128/JB.00559-19. Print 2020 Mar 26. J Bacteriol. 2020. PMID: 31792010 Free PMC article.
-
Friends or enemies? The complicated relationship between Pseudomonas aeruginosa and Staphylococcus aureus.Mol Microbiol. 2021 Jul;116(1):1-15. doi: 10.1111/mmi.14699. Epub 2021 Mar 8. Mol Microbiol. 2021. PMID: 33576132 Review.
-
Pseudomonas aeruginosa and Staphylococcus aureus communication in biofilm infections: insights through network and database construction.Crit Rev Microbiol. 2019 Sep-Nov;45(5-6):712-728. doi: 10.1080/1040841X.2019.1700209. Epub 2019 Dec 13. Crit Rev Microbiol. 2019. PMID: 31835971 Review.
Cited by
-
Precise spatial structure impacts antimicrobial susceptibility of S. aureus in polymicrobial wound infections.Proc Natl Acad Sci U S A. 2022 Dec 20;119(51):e2212340119. doi: 10.1073/pnas.2212340119. Epub 2022 Dec 15. Proc Natl Acad Sci U S A. 2022. PMID: 36520668 Free PMC article.
-
Single-Cell Imaging Reveals That Staphylococcus aureus Is Highly Competitive Against Pseudomonas aeruginosa on Surfaces.Front Cell Infect Microbiol. 2021 Aug 26;11:733991. doi: 10.3389/fcimb.2021.733991. eCollection 2021. Front Cell Infect Microbiol. 2021. PMID: 34513736 Free PMC article.
-
Application of a quantitative framework to improve the accuracy of a bacterial infection model.Proc Natl Acad Sci U S A. 2023 May 9;120(19):e2221542120. doi: 10.1073/pnas.2221542120. Epub 2023 May 1. Proc Natl Acad Sci U S A. 2023. PMID: 37126703 Free PMC article.
-
Pseudomonas aeruginosa surface motility and invasion into competing communities enhances interspecies antagonism.bioRxiv [Preprint]. 2024 Apr 4:2024.04.03.588010. doi: 10.1101/2024.04.03.588010. bioRxiv. 2024. Update in: mBio. 2024 Sep 11;15(9):e0095624. doi: 10.1128/mbio.00956-24. PMID: 38617332 Free PMC article. Updated. Preprint.
-
Extracellular vesicles of Pseudomonas aeruginosa downregulate pyruvate fermentation enzymes and inhibit the initial growth of Staphylococcus aureus.Curr Res Microb Sci. 2023 Apr 20;4:100190. doi: 10.1016/j.crmicr.2023.100190. eCollection 2023. Curr Res Microb Sci. 2023. PMID: 37131486 Free PMC article.
References
-
- Smith H. 1982. The role of microbial interactions in infectious disease. Phil Trans R Soc Lond B Biol Sci 297:551–561. - PubMed
Publication types
MeSH terms
Substances
Grants and funding
LinkOut - more resources
Full Text Sources
Other Literature Sources
Medical
