Estimating maximal microbial growth rates from cultures, metagenomes, and single cells via codon usage patterns
- PMID: 33723043
- PMCID: PMC8000110
- DOI: 10.1073/pnas.2016810118
Estimating maximal microbial growth rates from cultures, metagenomes, and single cells via codon usage patterns
Abstract
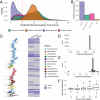
Maximal growth rate is a basic parameter of microbial lifestyle that varies over several orders of magnitude, with doubling times ranging from a matter of minutes to multiple days. Growth rates are typically measured using laboratory culture experiments. Yet, we lack sufficient understanding of the physiology of most microbes to design appropriate culture conditions for them, severely limiting our ability to assess the global diversity of microbial growth rates. Genomic estimators of maximal growth rate provide a practical solution to survey the distribution of microbial growth potential, regardless of cultivation status. We developed an improved maximal growth rate estimator and predicted maximal growth rates from over 200,000 genomes, metagenome-assembled genomes, and single-cell amplified genomes to survey growth potential across the range of prokaryotic diversity; extensions allow estimates from 16S rRNA sequences alone as well as weighted community estimates from metagenomes. We compared the growth rates of cultivated and uncultivated organisms to illustrate how culture collections are strongly biased toward organisms capable of rapid growth. Finally, we found that organisms naturally group into two growth classes and observed a bias in growth predictions for extremely slow-growing organisms. These observations ultimately led us to suggest evolutionary definitions of oligotrophy and copiotrophy based on the selective regime an organism occupies. We found that these growth classes are associated with distinct selective regimes and genomic functional potentials.
Keywords: codon usage bias; copiotrophy; microbial growth; oligotrophy.
Copyright © 2021 the Author(s). Published by PNAS.
Conflict of interest statement
The authors declare no competing interest.
Figures


Similar articles
-
Benchmarking Community-Wide Estimates of Growth Potential from Metagenomes Using Codon Usage Statistics.mSystems. 2022 Oct 26;7(5):e0074522. doi: 10.1128/msystems.00745-22. Epub 2022 Oct 3. mSystems. 2022. PMID: 36190138 Free PMC article.
-
Unexpected absence of ribosomal protein genes from metagenome-assembled genomes.ISME Commun. 2022 Nov 28;2(1):118. doi: 10.1038/s43705-022-00204-6. ISME Commun. 2022. PMID: 37938339 Free PMC article.
-
Environmental shaping of codon usage and functional adaptation across microbial communities.Nucleic Acids Res. 2013 Oct;41(19):8842-52. doi: 10.1093/nar/gkt673. Epub 2013 Aug 5. Nucleic Acids Res. 2013. PMID: 23921637 Free PMC article.
-
Integrating pan-genome with metagenome for microbial community profiling.Comput Struct Biotechnol J. 2021 Mar 7;19:1458-1466. doi: 10.1016/j.csbj.2021.02.021. eCollection 2021. Comput Struct Biotechnol J. 2021. PMID: 33841754 Free PMC article. Review.
-
Codon usage bias.Mol Biol Rep. 2022 Jan;49(1):539-565. doi: 10.1007/s11033-021-06749-4. Epub 2021 Nov 25. Mol Biol Rep. 2022. PMID: 34822069 Free PMC article. Review.
Cited by
-
Trait-trait relationships and tradeoffs vary with genome size in prokaryotes.Front Microbiol. 2022 Oct 21;13:985216. doi: 10.3389/fmicb.2022.985216. eCollection 2022. Front Microbiol. 2022. PMID: 36338105 Free PMC article.
-
Global patterns in the growth potential of soil bacterial communities.Nat Commun. 2024 Aug 11;15(1):6881. doi: 10.1038/s41467-024-50382-1. Nat Commun. 2024. PMID: 39128916 Free PMC article.
-
Microdiversity of the Vaginal Microbiome is Associated with Preterm Birth.bioRxiv [Preprint]. 2023 Jun 17:2023.01.13.523991. doi: 10.1101/2023.01.13.523991. bioRxiv. 2023. Update in: Nat Commun. 2023 Aug 17;14(1):4997. doi: 10.1038/s41467-023-40719-7. PMID: 36711990 Free PMC article. Updated. Preprint.
-
Ecogenomics sheds light on diverse lifestyle strategies in freshwater CPR.Microbiome. 2022 Jun 4;10(1):84. doi: 10.1186/s40168-022-01274-3. Microbiome. 2022. PMID: 35659305 Free PMC article.
-
A Reduction of Transcriptional Regulation in Aquatic Oligotrophic Microorganisms Enhances Fitness in Nutrient-Poor Environments.Microbiol Mol Biol Rev. 2023 Jun 28;87(2):e0012422. doi: 10.1128/mmbr.00124-22. Epub 2023 Mar 30. Microbiol Mol Biol Rev. 2023. PMID: 36995249 Free PMC article. Review.
References
-
- Monod J., The growth of bacterial cultures. Annu. Rev. Microbiol. 3, 371–394 (1949).
-
- Rappé M. S., Connon S. A., Vergin K. L., Giovannoni S. J., Cultivation of the ubiquitous sar11 marine bacterioplankton clade. Nature 418, 630–633 (2002). - PubMed
-
- Colwell F. S., D’Hondt S., Nature and extent of the deep biosphere. Rev. Mineral. Geochem. 75, 547–574 (2013).
Publication types
MeSH terms
LinkOut - more resources
Full Text Sources
Other Literature Sources

