

Insights into Cardiac IKs (KCNQ1/KCNE1) Channels Regulation
- PMID: 33322401
- PMCID: PMC7763278
- DOI: 10.3390/ijms21249440
Insights into Cardiac IKs (KCNQ1/KCNE1) Channels Regulation
Abstract
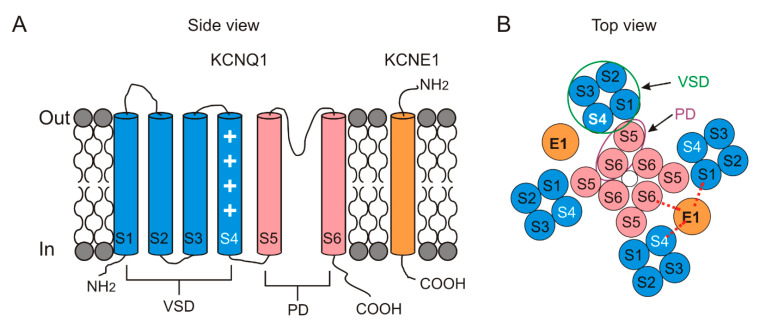
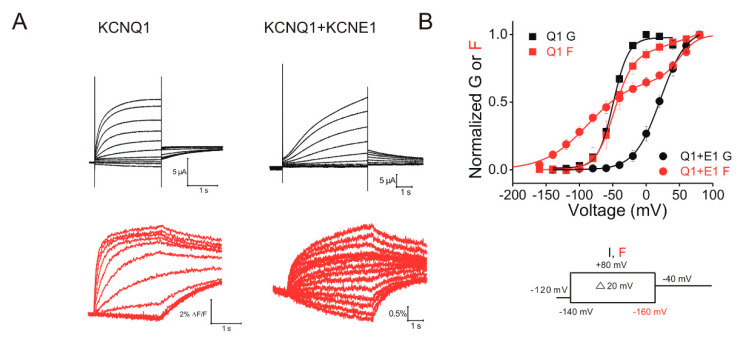
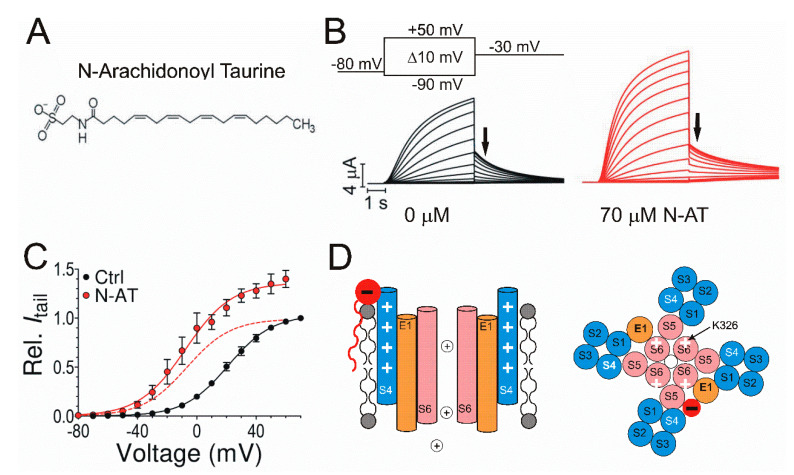
The delayed rectifier potassium IKs channel is an important regulator of the duration of the ventricular action potential. Hundreds of mutations in the genes (KCNQ1 and KCNE1) encoding the IKs channel cause long QT syndrome (LQTS). LQTS is a heart disorder that can lead to severe cardiac arrhythmias and sudden cardiac death. A better understanding of the IKs channel (here called the KCNQ1/KCNE1 channel) properties and activities is of great importance to find the causes of LQTS and thus potentially treat LQTS. The KCNQ1/KCNE1 channel belongs to the superfamily of voltage-gated potassium channels. The KCNQ1/KCNE1 channel consists of both the pore-forming subunit KCNQ1 and the modulatory subunit KCNE1. KCNE1 regulates the function of the KCNQ1 channel in several ways. This review aims to describe the current structural and functional knowledge about the cardiac KCNQ1/KCNE1 channel. In addition, we focus on the modulation of the KCNQ1/KCNE1 channel and its potential as a target therapeutic of LQTS.
Keywords: ATP; IKs; KCNE1; KCNQ1; Kv channel; PIP2; PKA; PUFA; cardiac arrhythmias; long QT syndrome.
Conflict of interest statement
The authors declare no conflict of interest.
Figures

Similar articles
-
PUFA stabilizes a conductive state of the selectivity filter in IKs channels.Elife. 2024 Oct 31;13:RP95852. doi: 10.7554/eLife.95852. Elife. 2024. PMID: 39480699 Free PMC article.
-
Dysfunctional potassium channel subunit interaction as a novel mechanism of long QT syndrome.Heart Rhythm. 2013 May;10(5):728-37. doi: 10.1016/j.hrthm.2012.12.033. Epub 2013 Jan 2. Heart Rhythm. 2013. PMID: 23291057 Free PMC article.
-
LQT1 mutations in KCNQ1 C-terminus assembly domain suppress IKs using different mechanisms.Cardiovasc Res. 2014 Dec 1;104(3):501-11. doi: 10.1093/cvr/cvu231. Epub 2014 Oct 24. Cardiovasc Res. 2014. PMID: 25344363 Free PMC article.
-
Recent molecular insights from mutated IKS channels in cardiac arrhythmia.Curr Opin Pharmacol. 2014 Apr;15:74-82. doi: 10.1016/j.coph.2013.12.004. Epub 2013 Dec 30. Curr Opin Pharmacol. 2014. PMID: 24721657 Review.
-
The role of abnormal trafficking of KCNE1 in long QT syndrome 5.Biochem Soc Trans. 2007 Nov;35(Pt 5):1074-6. doi: 10.1042/BST0351074. Biochem Soc Trans. 2007. PMID: 17956282 Review.
Cited by
-
Structural Modelling of KCNQ1 and KCNH2 Double Mutant Proteins, Identified in Two Severe Long QT Syndrome Cases, Reveals New Insights into Cardiac Channelopathies.Int J Mol Sci. 2021 Nov 28;22(23):12861. doi: 10.3390/ijms222312861. Int J Mol Sci. 2021. PMID: 34884666 Free PMC article.
-
Targeting the IKs Channel PKA Phosphorylation Axis to Restore Its Function in High-Risk LQT1 Variants.Circ Res. 2024 Sep 13;135(7):722-738. doi: 10.1161/CIRCRESAHA.124.325009. Epub 2024 Aug 21. Circ Res. 2024. PMID: 39166328 Free PMC article.
-
Transient titin-dependent ventricular defects during development lead to adult atrial arrhythmia and impaired contractility.iScience. 2024 Jun 27;27(7):110395. doi: 10.1016/j.isci.2024.110395. eCollection 2024 Jul 19. iScience. 2024. PMID: 39100923 Free PMC article.
-
Subtype-specific responses of hKv7.4 and hKv7.5 channels to polyunsaturated fatty acids reveal an unconventional modulatory site and mechanism.Elife. 2022 Jun 1;11:e77672. doi: 10.7554/eLife.77672. Elife. 2022. PMID: 35642964 Free PMC article.
-
Pharmacological Screening of Kv7.1 and Kv7.1/KCNE1 Activators as Potential Antiarrhythmic Drugs in the Zebrafish Heart.Int J Mol Sci. 2023 Jul 28;24(15):12092. doi: 10.3390/ijms241512092. Int J Mol Sci. 2023. PMID: 37569465 Free PMC article.
References
Publication types
MeSH terms
Substances
Grants and funding
LinkOut - more resources
Full Text Sources
