. 2020 Mar 13:11:453-465.
doi: 10.3762/bjnano.11.37. eCollection 2020.

Current measurements in the intermittent-contact mode of atomic force microscopy using the Fourier method: a feasibility analysis

Affiliations

Current measurements in the intermittent-contact mode of atomic force microscopy using the Fourier method: a feasibility analysis

Berkin Uluutku et al. Beilstein J Nanotechnol. .

Abstract

Atomic force microscopy (AFM) is an important tool for measuring a variety of nanoscale surface properties, such as topography, viscoelasticity, electrical potential and conductivity. Some of these properties are measured using contact methods (static contact or intermittent contact), while others are measured using noncontact methods. Some properties can be measured using different approaches. Conductivity, in particular, is mapped using the contact-mode method. However, this modality can be destructive to delicate samples, since it involves continuously dragging the cantilever tip on the surface during the raster scan, while a constant tip-sample force is applied. In this paper we discuss a possible approach to develop an intermittent-contact conductive AFM mode based on Fourier analysis, whereby the measured current response consists of higher harmonics of the cantilever oscillation frequency. Such an approach may enable the characterization of soft samples with less damage than contact-mode imaging. To explore its feasibility, we derive the analytical form of the tip-sample current that would be obtained for attractive (noncontact) and repulsive (intermittent-contact) dynamic AFM characterization, and compare it with results obtained from numerical simulations. Although significant instrumentation challenges are anticipated, the modelling results are promising and suggest that Fourier-based higher-harmonics current measurement may enable the development of a reliable intermittent-contact conductive AFM method.

Keywords: Fourier analysis; atomic force microscopy (AFM); conductivity; current; intermittent contact; tapping-mode AFM.


Figures

Figure 1
Figure 1
Illustration of a tip trajectory with a perfect sinusoidal shape in the noncontact dynamic AFM mode. The blue line represents the tip motion about the equilibrium position of the cantilever, while the solid black line represents the surface position, fixed at reference point zero. h is the cantilever rest position and d is the instantaneous tip–sample distance.
Figure 2
Figure 2
Modified Bessel functions of the first kind of different orders. While the zeroth-order function approaches unity at the origin, higher-order functions approach zero quite steeply. Higher-order functions converge to zero more quickly than their lower-order counterparts as the origin is approached from the right.
Figure 3
Figure 3
Illustration of the intermittent-contact interaction case. The blue line represents ψ, the trajectory of the tip about the equilibrium position of the cantilever, while the solid black line represents the surface position, fixed at reference point zero. h is the cantilever rest position, T is the fundamental period of the tip trajectory, d is the indentation, and formula image 
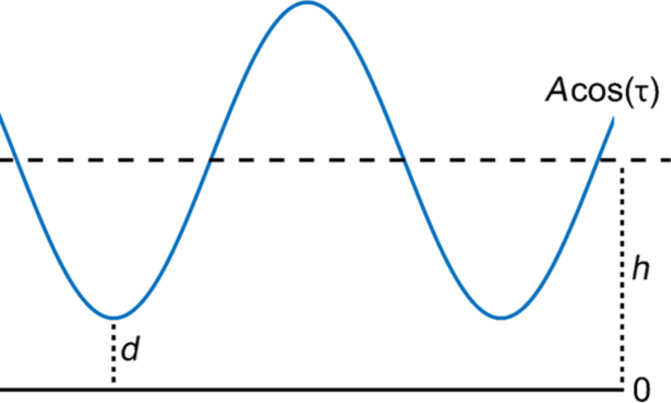
is the contact time.
Figure 4
Figure 4
Illustration of the derivation of the indentation. The upper blue line represents the tip–sample distance. Multiplying that function with a square pulse function (black line) with duty cycle equal to the contact time, and changing sign, yields the indentation, represented by the lower blue line.
Figure 5
Figure 5
Normalised power spectrum of the current obtained for the noncontact, ideal-trajectory case. The blue lines indicate the power spectrum obtained via Fourier transform of the current, while the orange dots correspond to the predicted peaks from Equation 8. The first 50 elements of the infinite sum in Equation 8 were used for evaluating the equation. The results are in agreement with each other. Both the power spectrum and the predicted peaks are normalized. The figure also shows that the first harmonic (70 kHz), is the strongest peak in the spectrum, although the decay of the higher harmonic values is not rapid. Our calculations show that the peaks diminish to ca. 20% of the maximum peak value at a frequency of approximately 3.2 MHz, which roughly corresponds to the 46th harmonic.
Figure 6
Figure 6
a) Power spectrum of the cantilever trajectory. The higher harmonic amplitudes are very small compared to the first harmonic amplitude, and their peaks are not visible in the spectrum with linear vertical axis. However, they are ever present and can be seen in a logarithmic plot (b), where the second harmonic is almost 1000 times smaller than the first harmonic.
Figure 7
Figure 7
Power spectrum of the current from analytical calculations and numerical cantilever simulations for a noncontact case with attractive tip–sample forces. The blue lines correspond to the calculated power spectrum from the numerical simulation and the orange crosses correspond to the prediction from Equation 13, for the case where only one cosine term is included in Equation 12. The agreement between the two results is very good, as expected, since the higher harmonics of the tip trajectory decrease very rapidly. Pink dots are used to represent the two-cosine analytical prediction. Due to the rapid decrease of the higher harmonic amplitudes of the tip trajectory, the single- and two-cosine results fall almost on top of each other and are visually indistinguishable. The average difference between the single- and two-cosine calculations for the first 50 harmonics is 0.18%. Both calculations are normalised.
Figure 8
Figure 8
a) Power spectrum of the tip trajectory for the realistic simulation with the Hertzian repulsive interaction (the simulation parameters are provided in Table 2). The higher harmonic amplitudes of the tip oscillation are much smaller than the first harmonic amplitude but do nonetheless influence the current response. b) Comparison of the power spectrum of the current for the realistic numerical simulation with the power spectrum of the unperturbed, single-cosine trajectory. The single-cosine trajectory is designed to have the same frequency and maximum indentation as the realistic trajectory. Although the higher-harmonic amplitudes in the realistic tip trajectory are quite small compared to the first harmonic amplitude (a), the spectra of the current differ for the two trajectories considered. Both spectra exhibit the expected sinc envelope shape, with the envelope being wider when the realistic tip trajectory is considered.
Figure 9
Figure 9
Current output obtained from the intermittent-contact simulation (black trace) and reconstruction of the current from different numbers of harmonics. As expected, inclusion of a larger number of harmonics in the reconstruction yields more accurate results. In this particular example, inclusion of 25 harmonics already leads to a very good reconstruction of the current. Since the behaviour of the harmonics coefficients as a function of frequency is not arbitrary, but rather expected to exhibit a sinc-shaped envelope, it may be possible to estimate a large number of higher harmonic amplitudes from a sparse collection of harmonics measured over a wide frequency range, such that a more accurate reconstruction is achieved.

Similar articles

References

    1. Noh H, Diaz A J, Solares S D. Beilstein J Nanotechnol. 2017;8:579–589. doi: 10.3762/bjnano.8.62. - DOI - PMC - PubMed
    1. O’Dea J R, Brown L M, Hoepker N, Marohn J A, Sadewasser S. MRS Bull. 2012;37:642–650. doi: 10.1557/mrs.2012.143. - DOI
    1. Pingree L S C, Reid O G, Ginger D S. Adv Mater (Weinheim, Ger) 2009;21:19–28. doi: 10.1002/adma.200801466. - DOI
    1. Pingree L S C, Reid O G, Ginger D S. Nano Lett. 2009;9:2946–2952. doi: 10.1021/nl901358v. - DOI - PubMed
    1. Reid O G, Munechika K, Ginger D S. Nano Lett. 2008;8:1602–1609. doi: 10.1021/nl080155l. - DOI - PubMed

Grants and funding

The authors gratefully acknowledge support from the US Department of Energy, Office of Science, Basic Energy Sciences, under Award No. DE-SC0018041.

LinkOut - more resources