

Tropical pitcher plants (Nepenthes) act as ecological filters by altering properties of their fluid microenvironments
- PMID: 32157122
- PMCID: PMC7064508
- DOI: 10.1038/s41598-020-61193-x
Tropical pitcher plants (Nepenthes) act as ecological filters by altering properties of their fluid microenvironments
Abstract
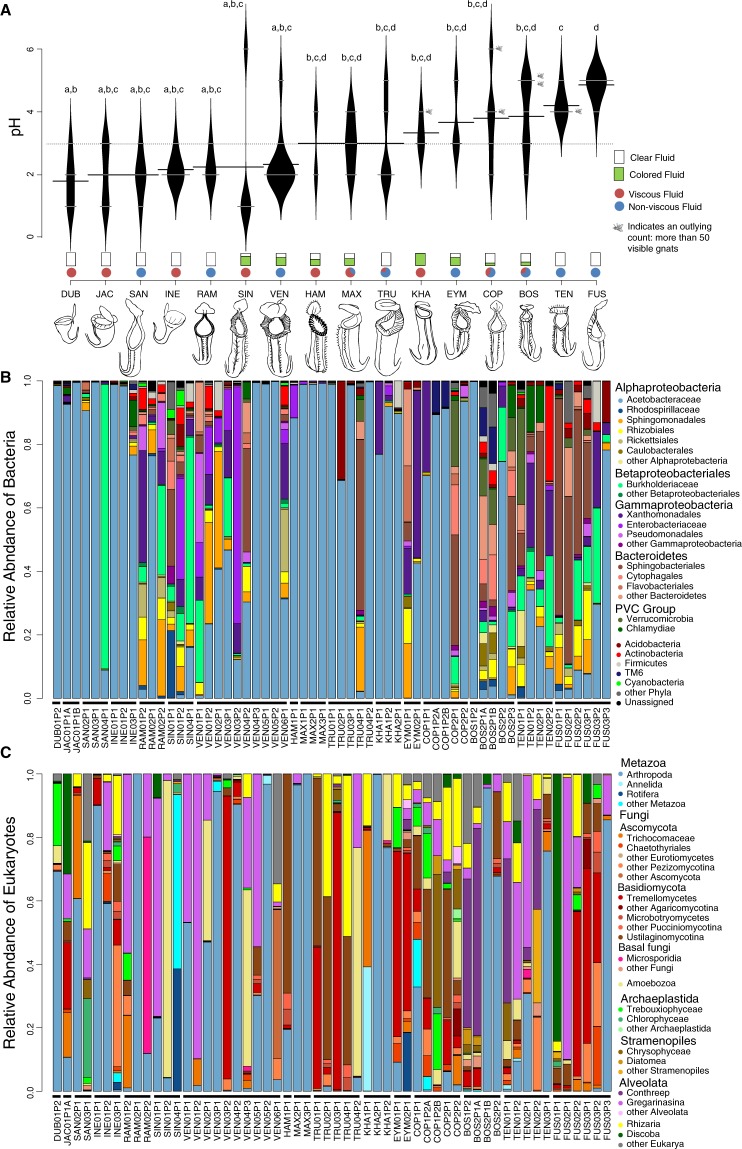
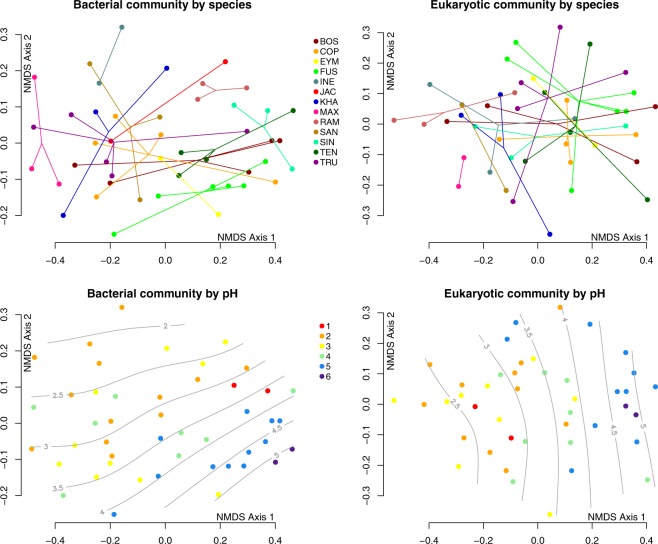
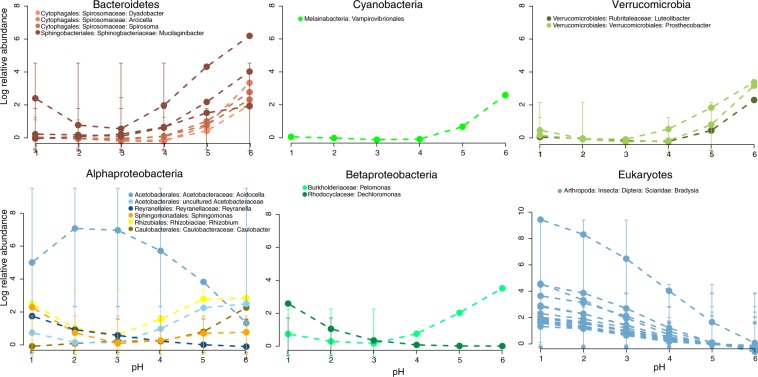
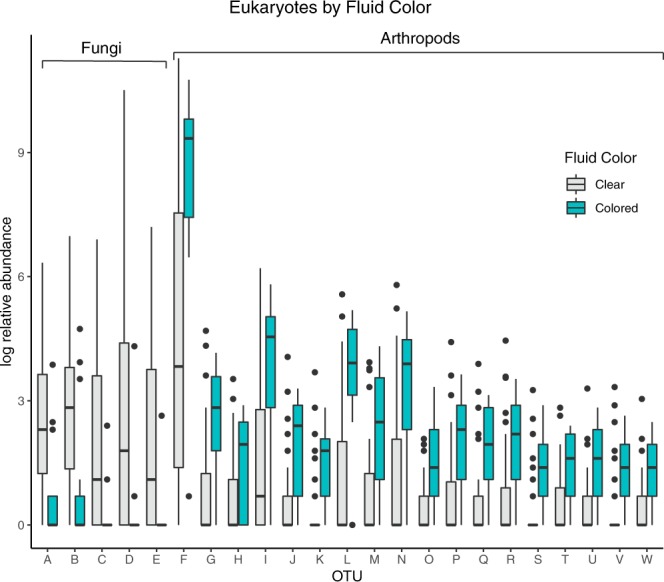
Characteristics of host species can alter how other, interacting species assemble into communities by acting as ecological filters. Pitchers of tropical pitcher plants (Nepenthes) host diverse communities of aquatic arthropods and microbes in nature. This plant genus exhibits considerable interspecific diversity in morphology and physiology; for example, different species can actively control the pH of their pitcher fluids and some species produce viscoelastic fluids. Our study investigated the extent to which Nepenthes species differentially regulate pitcher fluid traits under common garden conditions, and the effects that these trait differences had on their associated communities. Sixteen species of Nepenthes were reared together in the controlled environment of a glasshouse using commonly-sourced pH 6.5 water. We analyzed their bacterial and eukaryotic communities using metabarcoding techniques, and found that different plant species differentially altered fluid pH, viscosity, and color, and these had strong effects on the community structure of their microbiota. Nepenthes species can therefore act as ecological filters, cultivating distinctive microbial communities despite similar external conditions, and blurring the conceptual line between biotic and abiotic filters.
Conflict of interest statement
The authors declare no competing interests.
Figures
Similar articles
-
Bacterial communities associated with the pitcher fluids of three Nepenthes (Nepenthaceae) pitcher plant species growing in the wild.Arch Microbiol. 2014 Oct;196(10):709-17. doi: 10.1007/s00203-014-1011-1. Epub 2014 Jul 9. Arch Microbiol. 2014. PMID: 25005571
-
Bacterial Diversity and Community Structure in Two Bornean Nepenthes Species with Differences in Nitrogen Acquisition Strategies.Microb Ecol. 2016 May;71(4):938-53. doi: 10.1007/s00248-015-0723-3. Epub 2016 Jan 20. Microb Ecol. 2016. PMID: 26790863
-
Investigation of an Elevational Gradient Reveals Strong Differences Between Bacterial and Eukaryotic Communities Coinhabiting Nepenthes Phytotelmata.Microb Ecol. 2020 Aug;80(2):334-349. doi: 10.1007/s00248-020-01503-y. Epub 2020 Apr 14. Microb Ecol. 2020. PMID: 32291478 Free PMC article.
-
Traps of carnivorous pitcher plants as a habitat: composition of the fluid, biodiversity and mutualistic activities.Ann Bot. 2011 Feb;107(2):181-94. doi: 10.1093/aob/mcq238. Epub 2010 Dec 15. Ann Bot. 2011. PMID: 21159782 Free PMC article. Review.
-
The carnivorous syndrome in Nepenthes pitcher plants: current state of knowledge and potential future directions.Plant Signal Behav. 2010 Jun;5(6):644-8. doi: 10.4161/psb.5.6.11238. Plant Signal Behav. 2010. PMID: 21135573 Free PMC article. Review.
Cited by
-
Characterization and Comparison of Convergence Among Cephalotus follicularis Pitcher Plant-Associated Communities With Those of Nepenthes and Sarracenia Found Worldwide.Front Plant Sci. 2022 Jun 6;13:887635. doi: 10.3389/fpls.2022.887635. eCollection 2022. Front Plant Sci. 2022. PMID: 35734258 Free PMC article.
-
The digestive systems of carnivorous plants.Plant Physiol. 2022 Aug 29;190(1):44-59. doi: 10.1093/plphys/kiac232. Plant Physiol. 2022. PMID: 35604105 Free PMC article. Review.
-
Carnivorous Nepenthes Pitchers with Less Acidic Fluid House Nitrogen-Fixing Bacteria.Appl Environ Microbiol. 2023 Jul 26;89(7):e0081223. doi: 10.1128/aem.00812-23. Epub 2023 Jun 20. Appl Environ Microbiol. 2023. PMID: 37338413 Free PMC article.
-
On the move: sloths and their epibionts as model mobile ecosystems.Biol Rev Camb Philos Soc. 2021 Dec;96(6):2638-2660. doi: 10.1111/brv.12773. Epub 2021 Jul 26. Biol Rev Camb Philos Soc. 2021. PMID: 34309191 Free PMC article. Review.
-
Transcriptomic and Proteomic Analyses of Nepenthes ampullaria and Nepenthes rafflesiana Reveal Parental Molecular Expression in the Pitchers of Their Hybrid, Nepenthes × hookeriana.Front Plant Sci. 2021 Jan 20;11:625507. doi: 10.3389/fpls.2020.625507. eCollection 2020. Front Plant Sci. 2021. PMID: 33552113 Free PMC article.
References
-
- Itô H, Hino T. Dwarf bamboo as an ecological filter for forest regeneration. Ecological Research. 2007;22:706–711. doi: 10.1007/s11284-006-0066-0. - DOI
-
- Muñoz JC, et al. Contribution of woody habitat islands to the conservation of birds and their potential ecosystem services in an extensive Colombian rangeland. Agriculture, Ecosystems &. Environment. 2013;173:13–19.
Publication types
MeSH terms
LinkOut - more resources
Full Text Sources
