

RNA Interactions Are Essential for CTCF-Mediated Genome Organization
- PMID: 31522988
- PMCID: PMC7195841
- DOI: 10.1016/j.molcel.2019.08.015
RNA Interactions Are Essential for CTCF-Mediated Genome Organization
Abstract
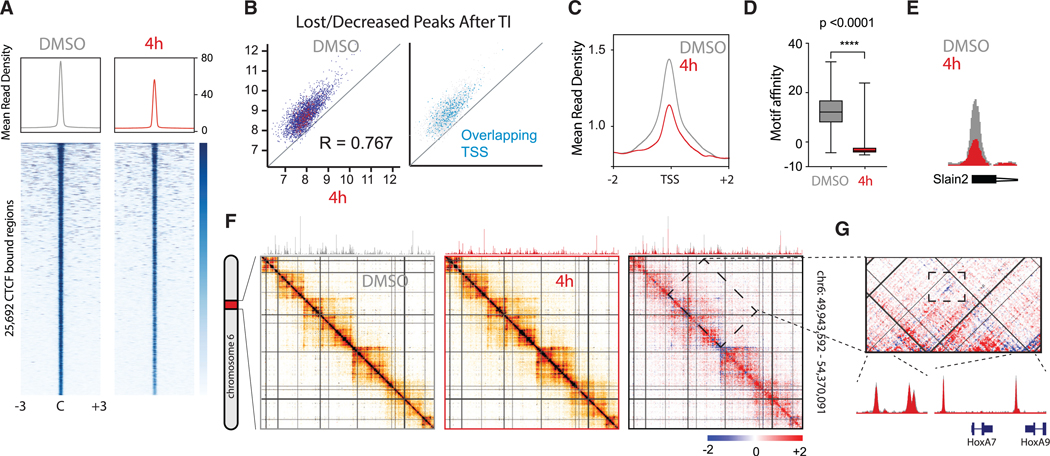
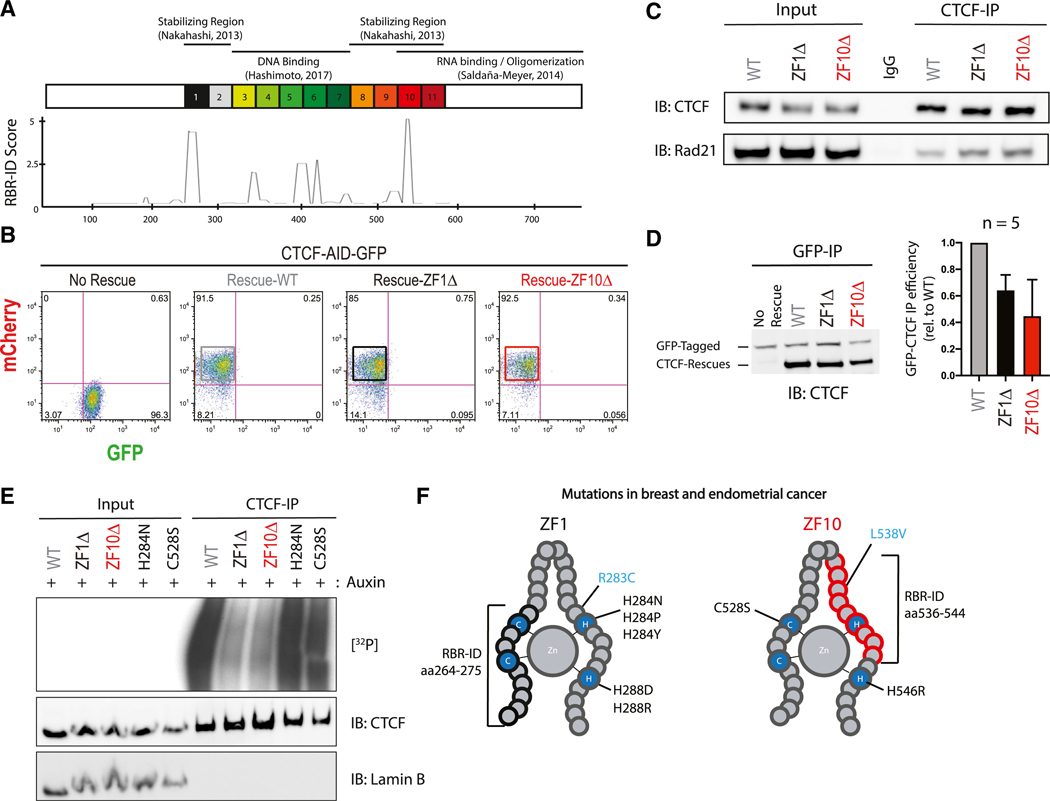
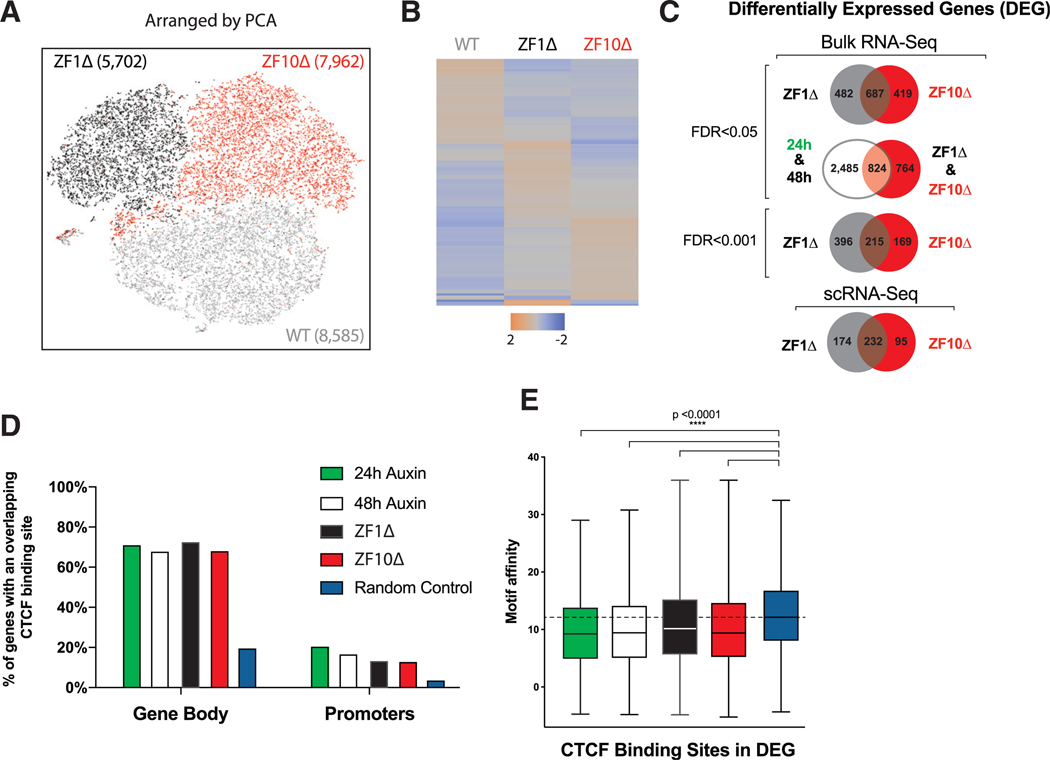
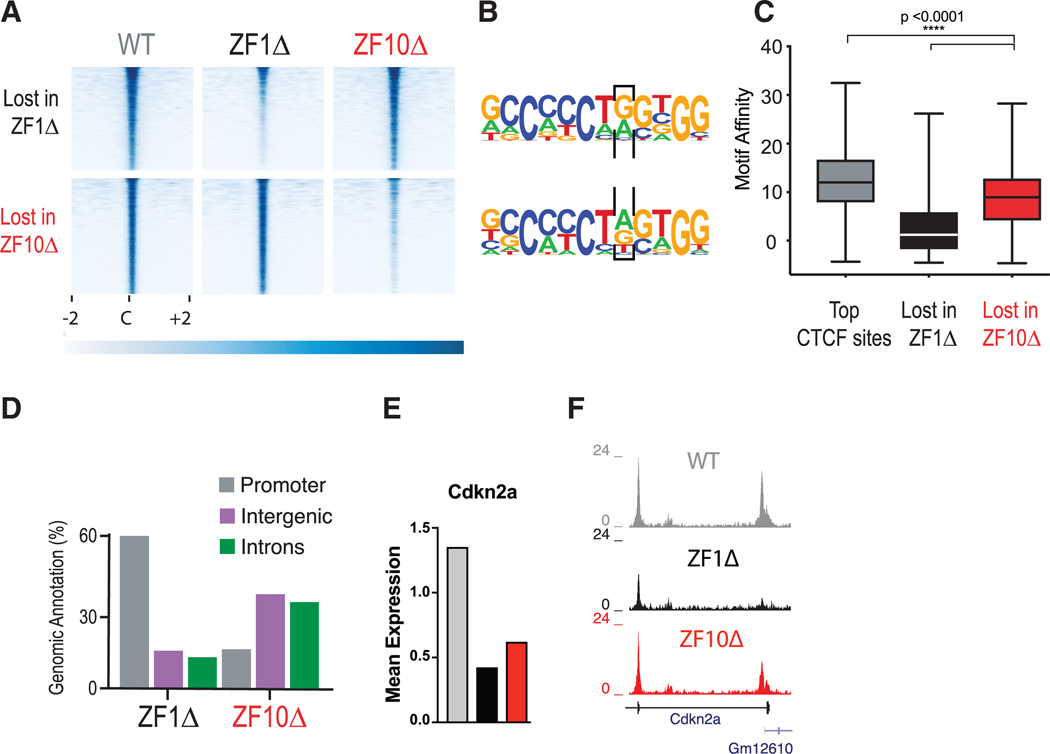
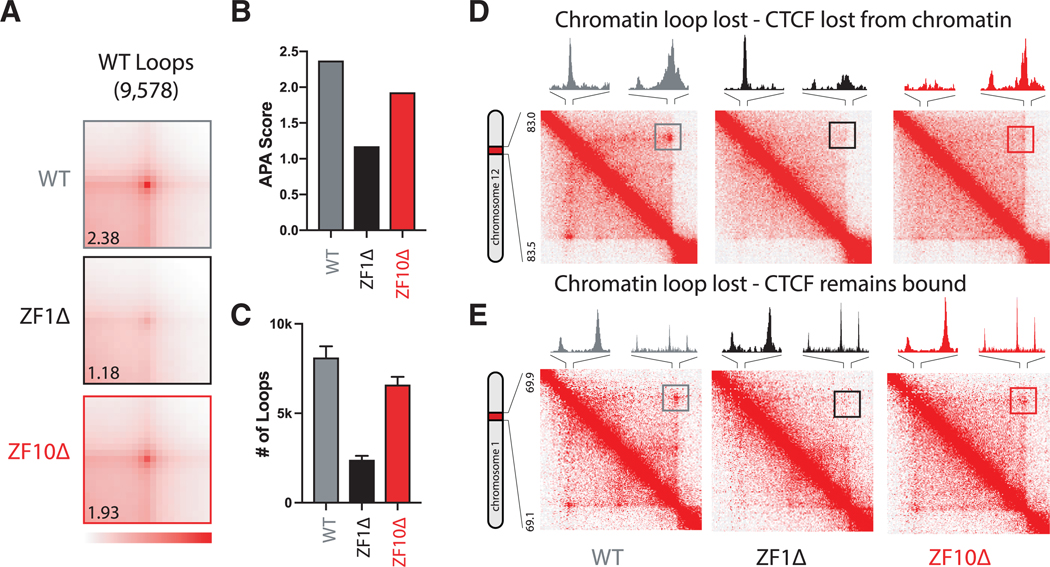
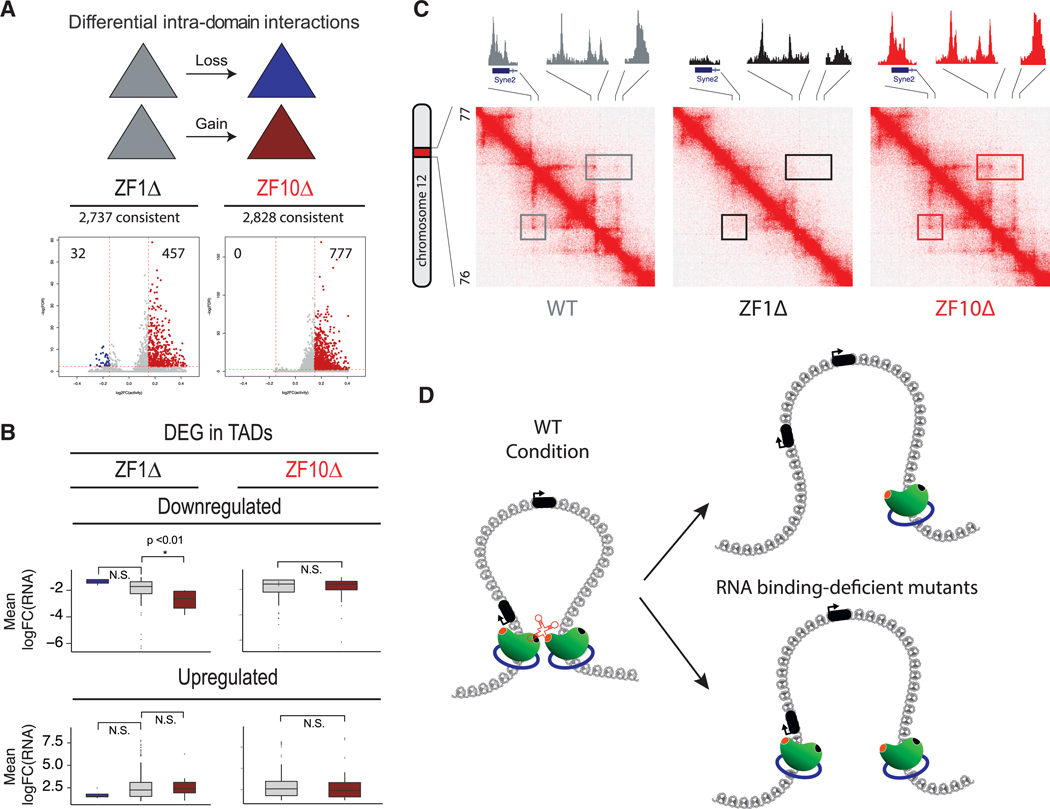
The function of the CCCTC-binding factor (CTCF) in the organization of the genome has become an important area of investigation, but the mechanisms by which CTCF dynamically contributes to genome organization are not clear. We previously discovered that CTCF binds to large numbers of endogenous RNAs, promoting its self-association. In this regard, we now report two independent features that disrupt CTCF association with chromatin: inhibition of transcription and disruption of CTCF-RNA interactions through mutations of 2 of its 11 zinc fingers that are not required for CTCF binding to its cognate DNA site: zinc finger 1 (ZF1) or zinc finger 10 (ZF10). These mutations alter gene expression profiles as CTCF mutants lose their ability to form chromatin loops and thus the ability to insulate chromatin domains and to mediate CTCF long-range genomic interactions. Our results point to the importance of CTCF-mediated RNA interactions as a structural component of genome organization.
Keywords: CTCF; RNA binding; RNA deficient-mutants; TADs; chromatin domains; chromatin loops; chromatin organization; gene expression; transcriptional inhibition.
Copyright © 2019 Elsevier Inc. All rights reserved.
Conflict of interest statement
DECLARATION OF INTERESTS
D.R. is a co-founder of Constellation Pharmaceuticals and Fulcrum Therapeutics. R.S.-M. is a co-founder of RNA Life Sciences Consulting. All other authors declare no competing interests.
Figures
Similar articles
-
Distinct Classes of Chromatin Loops Revealed by Deletion of an RNA-Binding Region in CTCF.Mol Cell. 2019 Nov 7;76(3):395-411.e13. doi: 10.1016/j.molcel.2019.07.039. Epub 2019 Sep 12. Mol Cell. 2019. PMID: 31522987 Free PMC article.
-
Single-molecule imaging reveals a direct role of CTCF's zinc fingers in SA interaction and cluster-dependent RNA recruitment.Nucleic Acids Res. 2024 Jun 24;52(11):6490-6506. doi: 10.1093/nar/gkae391. Nucleic Acids Res. 2024. PMID: 38742641 Free PMC article.
-
CTCF mediates dosage- and sequence-context-dependent transcriptional insulation by forming local chromatin domains.Nat Genet. 2021 Jul;53(7):1064-1074. doi: 10.1038/s41588-021-00863-6. Epub 2021 May 17. Nat Genet. 2021. PMID: 34002095 Free PMC article.
-
A tour of 3D genome with a focus on CTCF.Semin Cell Dev Biol. 2019 Jun;90:4-11. doi: 10.1016/j.semcdb.2018.07.020. Epub 2018 Jul 23. Semin Cell Dev Biol. 2019. PMID: 30031214 Review.
-
CTCF: a Swiss-army knife for genome organization and transcription regulation.Essays Biochem. 2019 Apr 23;63(1):157-165. doi: 10.1042/EBC20180069. Print 2019 Apr 23. Essays Biochem. 2019. PMID: 30940740 Review.
Cited by
-
Epigenetics and Heart Development.Front Cell Dev Biol. 2021 May 6;9:637996. doi: 10.3389/fcell.2021.637996. eCollection 2021. Front Cell Dev Biol. 2021. PMID: 34026751 Free PMC article. Review.
-
Denaturing purifications demonstrate that PRC2 and other widely reported chromatin proteins do not appear to bind directly to RNA in vivo.Mol Cell. 2024 Apr 4;84(7):1271-1289.e12. doi: 10.1016/j.molcel.2024.01.026. Epub 2024 Feb 21. Mol Cell. 2024. PMID: 38387462
-
LncSEA 2.0: an updated platform for long non-coding RNA related sets and enrichment analysis.Nucleic Acids Res. 2024 Jan 5;52(D1):D919-D928. doi: 10.1093/nar/gkad1008. Nucleic Acids Res. 2024. PMID: 37986229 Free PMC article.
-
Transcription regulation by long non-coding RNAs: mechanisms and disease relevance.Nat Rev Mol Cell Biol. 2024 May;25(5):396-415. doi: 10.1038/s41580-023-00694-9. Epub 2024 Jan 19. Nat Rev Mol Cell Biol. 2024. PMID: 38242953 Free PMC article. Review.
-
Promoter and enhancer RNAs regulate chromatin reorganization and activation of miR-10b/HOXD locus, and neoplastic transformation in glioma.Mol Cell. 2022 May 19;82(10):1894-1908.e5. doi: 10.1016/j.molcel.2022.03.018. Epub 2022 Apr 6. Mol Cell. 2022. PMID: 35390275 Free PMC article.
References
-
- Alipanahi B, Delong A, Weirauch MT, and Frey BJ (2015). Predicting the sequence specificities of DNA- and RNA-binding proteins by deep learning. Nat. Biotechnol 33, 831–838. - PubMed
-
- Bonev B, and Cavalli G. (2016). Organization and function of the 3D genome. Nat. Rev. Genet 17, 661–678. - PubMed
-
- Butcher DT, and Rodenhiser DI (2007). Epigenetic inactivation of BRCA1 is associated with aberrant expression of CTCF and DNA methyltransferase (DNMT3B) in some sporadic breast tumours. Eur. J. Cancer 43, 210–219. - PubMed
Publication types
MeSH terms
Substances
Grants and funding
LinkOut - more resources
Full Text Sources
Other Literature Sources
Molecular Biology Databases
