. 2017 Oct 10;8(5):e01639-17.
doi: 10.1128/mBio.01639-17.

More than Enzymes That Make or Break Cyclic Di-GMP-Local Signaling in the Interactome of GGDEF/EAL Domain Proteins of Escherichia coli

Affiliations

More than Enzymes That Make or Break Cyclic Di-GMP-Local Signaling in the Interactome of GGDEF/EAL Domain Proteins of Escherichia coli

Olga Sarenko et al. mBio. .

Abstract

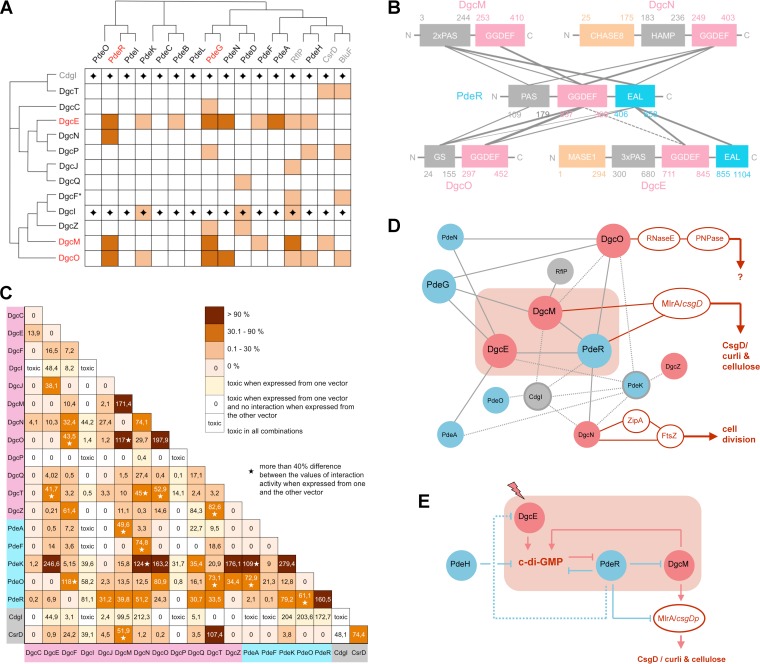
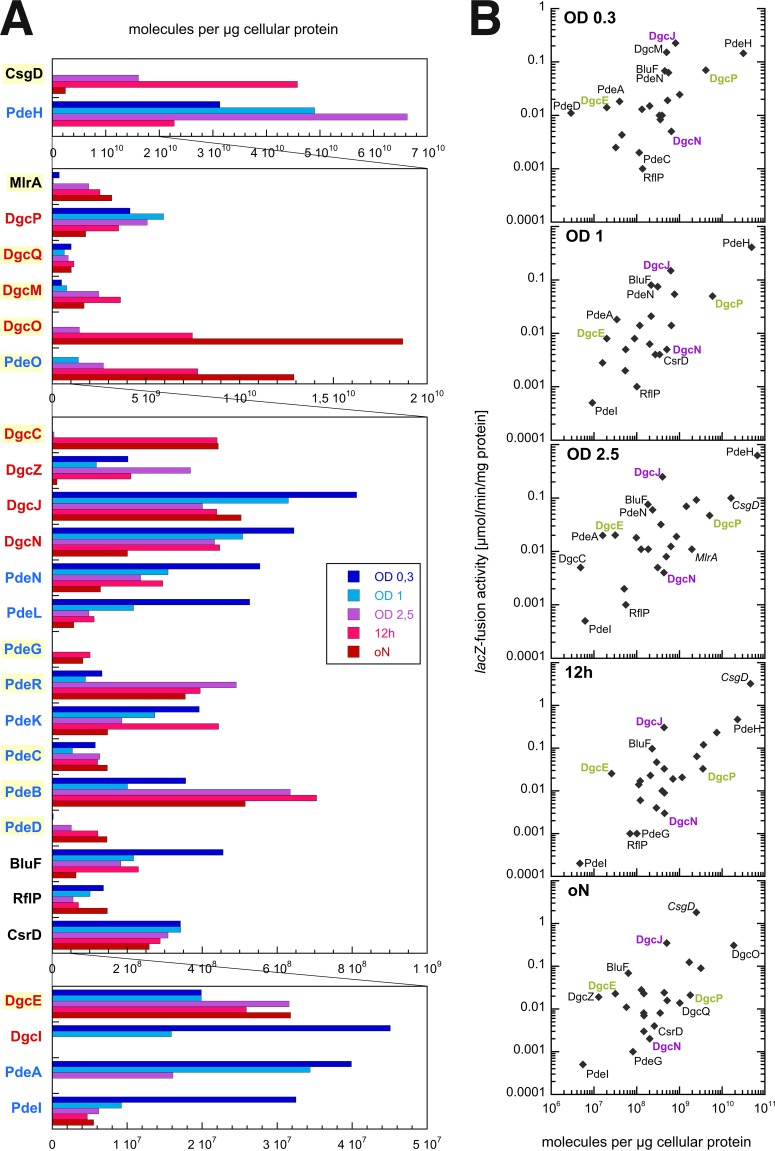
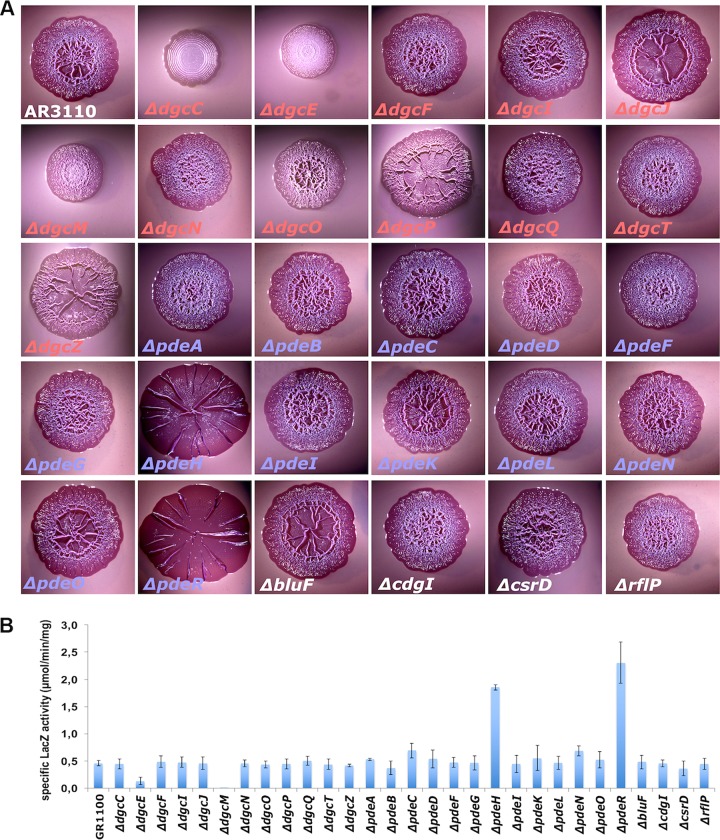
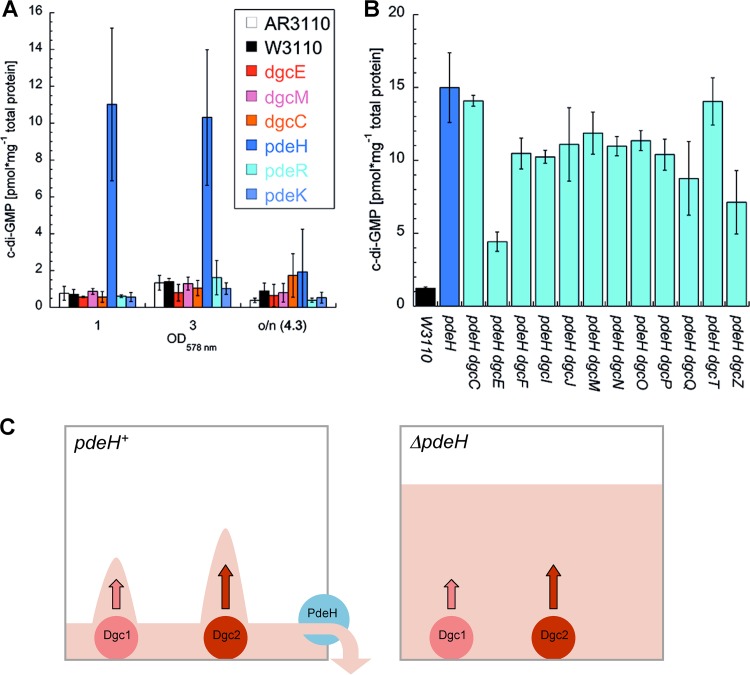
The bacterial second messenger bis-(3'-5')-cyclic diguanosine monophosphate (c-di-GMP) ubiquitously promotes bacterial biofilm formation. Intracellular pools of c-di-GMP seem to be dynamically negotiated by diguanylate cyclases (DGCs, with GGDEF domains) and specific phosphodiesterases (PDEs, with EAL or HD-GYP domains). Most bacterial species possess multiple DGCs and PDEs, often with surprisingly distinct and specific output functions. One explanation for such specificity is "local" c-di-GMP signaling, which is believed to involve direct interactions between specific DGC/PDE pairs and c-di-GMP-binding effector/target systems. Here we present a systematic analysis of direct protein interactions among all 29 GGDEF/EAL domain proteins of Escherichia coli Since the effects of interactions depend on coexpression and stoichiometries, cellular levels of all GGDEF/EAL domain proteins were also quantified and found to vary dynamically along the growth cycle. Instead of detecting specific pairs of interacting DGCs and PDEs, we discovered a tightly interconnected protein network of a specific subset or "supermodule" of DGCs and PDEs with a coregulated core of five hyperconnected hub proteins. These include the DGC/PDE proteins representing the c-di-GMP switch that turns on biofilm matrix production in E. coli Mutants lacking these core hub proteins show drastic biofilm-related phenotypes but no changes in cellular c-di-GMP levels. Overall, our results provide the basis for a novel model of local c-di-GMP signaling in which a single strongly expressed master PDE, PdeH, dynamically eradicates global effects of several DGCs by strongly draining the global c-di-GMP pool and thereby restricting these DGCs to serving as local c-di-GMP sources that activate specific colocalized effector/target systems.IMPORTANCE c-di-GMP signaling in bacteria is believed to occur via changes in cellular c-di-GMP levels controlled by antagonistic and potentially interacting pairs of diguanylate cyclases (DGCs) and c-di-GMP phosphodiesterases (PDEs). Our systematic analysis of protein-protein interaction patterns of all 29 GGDEF/EAL domain proteins of E. coli, together with our measurements of cellular c-di-GMP levels, challenges both aspects of this current concept. Knocking out distinct DGCs and PDEs has drastic effects on E. coli biofilm formation without changing the cellular c-di-GMP level. In addition, rather than generally coming in interacting DGC/PDE pairs, a subset of DGCs and PDEs operates as central interaction hubs in a larger "supermodule," with other DGCs and PDEs behaving as "lonely players" without contacts to other c-di-GMP-related enzymes. On the basis of these data, we propose a novel concept of "local" c-di-GMP signaling in bacteria with multiple enzymes that make or break the second messenger c-di-GMP.

Keywords: biofilms; c-di-GMP; cellulose; curli; diguanylate cyclase; second messenger.


Figures

FIG 1
FIG 1
Systematic in vivo protein interaction patterns for all GGDEF and EAL domain proteins of E. coli K-12. Using the Bacterio-Match 2H system, interactions were tested for the indicated proteins and/or domains. Each protein or domain was expressed from pBT as well as from pTRG, with each interaction tested in both vector combinations (vector swap). Results were normalized for the strong interaction between RpoS (σS) and RssB (23) assayed in parallel in each experiment. (A) A vector swap-integrating interaction map of (i) the 12 DGCs or the degenerate GGDEF domain protein CdgI (vertical axis) and (ii) the 13 PDEs, the degenerate EAL domain proteins RflP and BluF, or the degenerate GGDEF-EAL domain protein CsrD (horizontal axis), based on either entire proteins (if cytoplasmic) or entire cytoplasmic protein regions, which include the GGDEF and/or EAL domains. The order of proteins reflects the phylogenetic relationship between their GGDEF domains (vertical axis) and EAL domains (horizontal axis). Interactions detected in both vector combinations are indicated in dark red, and interactions found in only one vector combination are indicated in light red (for details of quantification, see Materials and Methods; separate and quantitative reciprocal vector interaction landscapes are shown in Fig. S1 and numeric data and a raw data set in Fig. S2). The five proteins exhibiting three or more interactions that were dectectable in both configurations of the vector swap (“hubs”) are highlighted in red letters and define the “core interaction module.” Data for CdgI and DgcI do not include a vector swap (indicated by diamonds), since induction of these proteins from higher-copy-number vector pTRG was toxic. DgcF (*) was obtained from E. coli 55989, since the dgcF gene is disrupted by a 5′ deletion in E. coli K-12 strains (6). (B) Specific domain-domain interactions between PdeR and the four DGCs found to interact with PdeR (as shown in panel A), integrating the data for the reciprocal vector combinations. Fat, thin, and dotted lines indicate different strengths of the interactions of the 2H proteins containing specific domains only (for the full quantitative data set, see Fig. S3). (C) Homomeric and heteromeric in vivo interactions among all 19 isolated GGDEF domains—derived from active DGCs as well as from degenerate GGDEF domain proteins—are shown as a Bacterio-Match 2H system-based interaction map. Numbers show strengths of interactions (determined as a percentage of the strength of the interaction between RpoS and RssB determined in parallel in each series of experiments) and represent averages for the respective vector swaps (an asterisk indicates a difference of >40% between the two reciprocal vector combinations). GGDEF domains with intact A-sites, i.e., those belonging to active DGCs, are highlighted in light red, degenerate GGDEF domains occurring in combination with intact EAL domains with PDE activity in light blue, and degenerate GGDEF domains not linked to an enzymatically active domain in gray. A yellow or white background color in the matrix indicates cases where induced expression of one GGDEF domain from the pTRG higher-copy-number vector resulted in toxicity; i.e., the result given is that of a single vector configuration. (D) Graphical summary of the protein-protein interaction network of GGDEF/EAL domain proteins. Lines (edges) represent direct interactions between connected proteins (only the interactions detectable in both reciprocal vector configurations of the 2H assays shown in panel A are taken into account). Gray lines represent results based on the data shown in panel A; dotted lines represent interactions between isolated GGDEF domains as shown in panel C; red lines represent direct interactions with the indicated effector/target systems previously reported and cited in the Discussion. DGCs, PDEs, and degenerate GGDEF/EAL domain proteins are shown as red, blue, and gray spheres, respectively, with a gray circle indicating interaction via a degenerate GGDEF domain. The light red box highlights the three members of the matrix control switch module (DgcE, DgcM, and PdeR) (13, 14) which, together with DgcO and PdeG, form the “core interaction hub,” i.e., the set of five interconnected proteins with more than three reciprocally detectable interactions each (highlighted in red letters in panel A). (E) The functional network of the matrix control switch module. The three proteins representing the matrix control switch module are included in the light red box as described for panel D, but instead of indicating protein-protein interactions, the lines indicate functional interactions. These can have positive/negative functional consequences (shown by arrows/blocking lines) such as either production/degradation of c-di-GMP by the indicated DGCs/PDEs or functional activation/inhibition by direct protein contacts.
FIG 2
FIG 2
Cellular levels and expression patterns of all GGDEF/EAL domain proteins of E. coli K-12. (A) Derivatives of strain W3110 expressing chromosomally encoded C-terminally 3× FLAG-tagged versions of GGDEF and/or EAL proteins as indicated were grown in LB medium at 28°C. Samples were taken at five representative stages during the growth curve (i.e., at optical densities at 578 [OD578] of 0.3, 1, and 2.5 and after 12 h of incubation [12h] and overnight incubation [oN]). Levels of specific proteins were determined by immunoblot analysis (using antibodies against 3× FLAG tag) with dilutions of purified PdeL::3× FLAG on the same SDS gels used for normalization (see Fig. S5). Data shown here represent averages of results from two biological replicates. A linear scale for protein abundance is used as this allows better visualization of variations in the levels of individual proteins along the growth cycle. However, since the variations in protein abundance among all detectable GGDEF/EAL domain proteins extended over more than 3 orders of magnitude, different scales had to be used for different sets of proteins, with panels with successively smaller scales ordered from top to bottom. Based on average cellular-protein-to-cell-number ratios for E. coli (58, 63), 107 molecules per μg cellular protein corresponds to approximately 1 molecule per cell, which—given the dimensions of E. coli K-12 cells in the postexponential growth phase (63)—corresponds to approximately 1 nM. Among the 29 GGDEF/EAL domain proteins, only four (DgcI, DgcF, DcgT, and CdgI) were not detectable. Proteins known to be under RpoS control are highlighted in yellow. (B) For comparisons of the relative levels of transcriptional activity and cellular protein, the specific activities of respective single-copy lacZ reporter fusions measured under the same conditions and previously published (24) were plotted against the protein level data as shown in panel A. Examples of proteins showing strong differences in gene expression but similar protein levels and vice versa are highlighted in purple and green, respectively.
FIG 3
FIG 3
Effects of knockout mutations in all GGDEF/EAL genes of E. coli K-12 on biofilm matrix as detected by macrocolony morphology and the expression of curli structural genes. (A) Macrocolony morphology of curli fibers and cellulose-producing strain AR3110 and the indicated mutant derivatives after growth on CR plates at 28°C for 5 days. Buckling of macrocolonies to form ridges, rings, and wrinkles depends on the amounts, on assembly into a nanocomposite, and on the spatial distribution of curli fibers and cellulose. For more details, see the text. (B) Expression of a single-copy csgB::lacZ reporter fusion. Derivatives of strain W3110 Δlac(I-A) carrying csgB::lacZ and deletion mutations in the indicated GGDEF/EAL domain-encoding genes were grown in liquid LB medium at 28°C. Specific β-galactosidase activities were determined in overnight cultures.
FIG 4
FIG 4
Cellular levels of c-di-GMP and a novel model of local c-di-GMP signaling. (A) Cellular c-di-GMP concentrations were determined for strains AR3110 and W3110 and for strain W3110 carrying mutations that affect biofilm matrix production (as shown in this panel) at different stages of the growth cycle (growing at 28°C in LB medium and sampled at the indicated OD578 levels and overnight). (B) Cellular c-di-GMP concentrations were determined for derivatives of the W3110 pdeH mutant also carrying secondary mutations that eliminate the 12 DGCs of E. coli K-12 (grown as described for panel B, with samples taken at an OD578 of 3). One picomole/mg cellular protein corresponds to approximately 60 molecules per cell or a cellular concentration of 60 nM (see also Fig. 2 legend). (C) The “fountain model” of local c-di-GMP signaling. In wild-type cells, the strongly expressed PdeH acts as a drain to maintain a low level of the cellular pool of c-di-GMP, with localized production by certain DGCs (the “fountains”) allowing activation of directly associated effector/target systems. In the absence of PdeH as a drain, local signaling is lost since the activities of the producing DGCs combine to drive up the level of the global cellular c-di-GMP pool.

Similar articles

Cited by

References

    1. Jenal U, Malone J. 2006. Mechanisms of cyclic-di-GMP signaling in bacteria. Annu Rev Genet 40:385–407. doi:10.1146/annurev.genet.40.110405.090423. - DOI - PubMed
    1. Hengge R. 2009. Principles of cyclic-di-GMP signaling. Nat Rev Microbiol 7:263–273. doi:10.1038/nrmicro2109. - DOI - PubMed
    1. Römling U, Galperin MY, Gomelsky M. 2013. Cyclic-di-GMP: the first 25 years of a universal bacterial second messenger. Microbiol Mol Biol Rev 77:1–52. doi:10.1128/MMBR.00043-12. - DOI - PMC - PubMed
    1. Jenal U, Reinders A, Lori C. 2017. Cyclic-di-GMP: second messenger extraordinaire. Nat Rev Microbiol 15:271–284. doi:10.1038/nrmicro.2016.190. - DOI - PubMed
    1. Hengge R, Galperin MY, Ghigo JM, Gomelsky M, Green J, Hughes KT, Jenal U, Landini P. 2015. Systematic nomenclature for GGDEF and EAL domain-containing cyclic di-GMP turnover proteins of Escherichia coli. J Bacteriol 198:7–11. doi:10.1128/JB.00424-15. - DOI - PMC - PubMed

MeSH terms

LinkOut - more resources