

A Children's Oncology Group and TARGET initiative exploring the genetic landscape of Wilms tumor
- PMID: 28825729
- PMCID: PMC5712232
- DOI: 10.1038/ng.3940
A Children's Oncology Group and TARGET initiative exploring the genetic landscape of Wilms tumor
Abstract
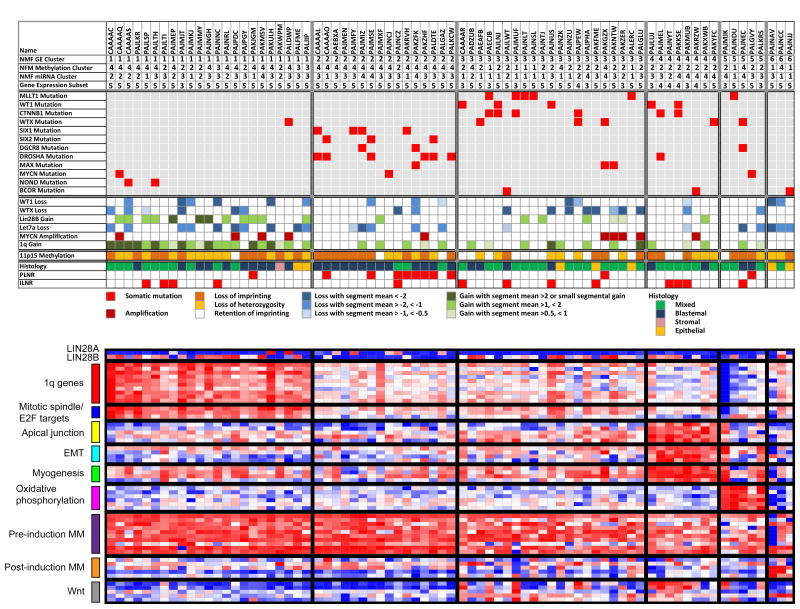
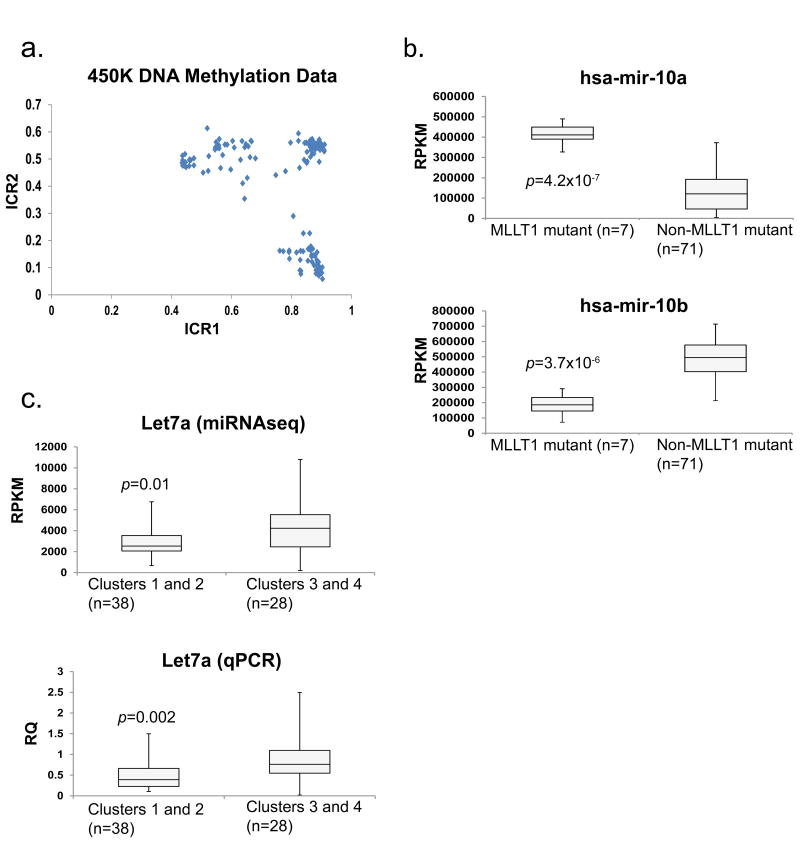
We performed genome-wide sequencing and analyzed mRNA and miRNA expression, DNA copy number, and DNA methylation in 117 Wilms tumors, followed by targeted sequencing of 651 Wilms tumors. In addition to genes previously implicated in Wilms tumors (WT1, CTNNB1, AMER1, DROSHA, DGCR8, XPO5, DICER1, SIX1, SIX2, MLLT1, MYCN, and TP53), we identified mutations in genes not previously recognized as recurrently involved in Wilms tumors, the most frequent being BCOR, BCORL1, NONO, MAX, COL6A3, ASXL1, MAP3K4, and ARID1A. DNA copy number changes resulted in recurrent 1q gain, MYCN amplification, LIN28B gain, and MIRLET7A loss. Unexpected germline variants involved PALB2 and CHEK2. Integrated analyses support two major classes of genetic changes that preserve the progenitor state and/or interrupt normal development.
Figures
Comment in
-
Kidney cancer: Targeting Wilms tumour.Nat Rev Nephrol. 2017 Nov;13(11):662. doi: 10.1038/nrneph.2017.131. Epub 2017 Sep 11. Nat Rev Nephrol. 2017. PMID: 28890538 No abstract available.
-
Paediatrics: Integrating genomics to dig deeper into Wilms tumour biology.Nat Rev Urol. 2017 Dec;14(12):703-704. doi: 10.1038/nrurol.2017.178. Epub 2017 Oct 25. Nat Rev Urol. 2017. PMID: 29068437 No abstract available.
Similar articles
-
Genetic changes associated with relapse in favorable histology Wilms tumor: A Children's Oncology Group AREN03B2 study.Cell Rep Med. 2022 Jun 21;3(6):100644. doi: 10.1016/j.xcrm.2022.100644. Epub 2022 May 25. Cell Rep Med. 2022. PMID: 35617957 Free PMC article.
-
Mutations in the SIX1/2 pathway and the DROSHA/DGCR8 miRNA microprocessor complex underlie high-risk blastemal type Wilms tumors.Cancer Cell. 2015 Feb 9;27(2):298-311. doi: 10.1016/j.ccell.2015.01.002. Cancer Cell. 2015. PMID: 25670083
-
Subtype-specific FBXW7 mutation and MYCN copy number gain in Wilms' tumor.Clin Cancer Res. 2010 Apr 1;16(7):2036-45. doi: 10.1158/1078-0432.CCR-09-2890. Epub 2010 Mar 23. Clin Cancer Res. 2010. PMID: 20332316 Free PMC article.
-
The yin and yang of kidney development and Wilms' tumors.Genes Dev. 2015 Mar 1;29(5):467-82. doi: 10.1101/gad.256396.114. Genes Dev. 2015. PMID: 25737276 Free PMC article. Review.
-
Origins of DNA methylation defects in Wilms tumors.Cancer Lett. 2019 Aug 10;457:119-128. doi: 10.1016/j.canlet.2019.05.013. Epub 2019 May 16. Cancer Lett. 2019. PMID: 31103718 Review.
Cited by
-
N6-methyladenosine modification of circMARK2 enhances cytoplasmic export and stabilizes LIN28B, contributing to the progression of Wilms tumor.J Exp Clin Cancer Res. 2024 Jul 11;43(1):191. doi: 10.1186/s13046-024-03113-9. J Exp Clin Cancer Res. 2024. Retraction in: J Exp Clin Cancer Res. 2025 Feb 18;44(1):59. doi: 10.1186/s13046-025-03326-6. PMID: 38987793 Free PMC article. Retracted.
-
Management of individuals with germline variants in PALB2: a clinical practice resource of the American College of Medical Genetics and Genomics (ACMG).Genet Med. 2021 Aug;23(8):1416-1423. doi: 10.1038/s41436-021-01151-8. Epub 2021 May 11. Genet Med. 2021. PMID: 33976419
-
A comprehensive overview of liquid biopsy applications in pediatric solid tumors.NPJ Precis Oncol. 2024 Aug 3;8(1):172. doi: 10.1038/s41698-024-00657-z. NPJ Precis Oncol. 2024. PMID: 39097671 Free PMC article. Review.
-
Race and Ethnic Group Enrollment and Outcomes for Wilms Tumor: Analysis of the Current Era Children's Oncology Group Study, AREN03B2.J Am Coll Surg. 2024 Apr 1;238(4):733-749. doi: 10.1097/XCS.0000000000000999. Epub 2024 Mar 15. J Am Coll Surg. 2024. PMID: 38251681
-
Prevalence, Molecular Landscape, and Clinical Impact of DICER1 and DGCR8 Mutated Follicular-Patterned Thyroid Nodules.J Clin Endocrinol Metab. 2024 Jun 17;109(7):1733-1744. doi: 10.1210/clinem/dgae034. J Clin Endocrinol Metab. 2024. PMID: 38252873 Free PMC article.
References
-
- Wegert J, et al. Mutations in the SIX1/2 pathway and the DROSHA/DGCR8 miRNA microprocessor complex underlie high-risk blastemal type WTs. Cancer Cell. 2015;27:298–311. - PubMed
-
- Beckwith JB, Palmer NF. Histopathology and prognosis of Wilms tumors: results from the First National Wilms Tumor Study. Cancer. 1978;41:1937–48. - PubMed
MeSH terms
Substances
Grants and funding
LinkOut - more resources
Full Text Sources
Other Literature Sources
Medical
Research Materials
Miscellaneous
