
Somatic mutations and progressive monosomy modify SAMD9-related phenotypes in humans

Federica Buonocore et al. J Clin Invest. .

Abstract

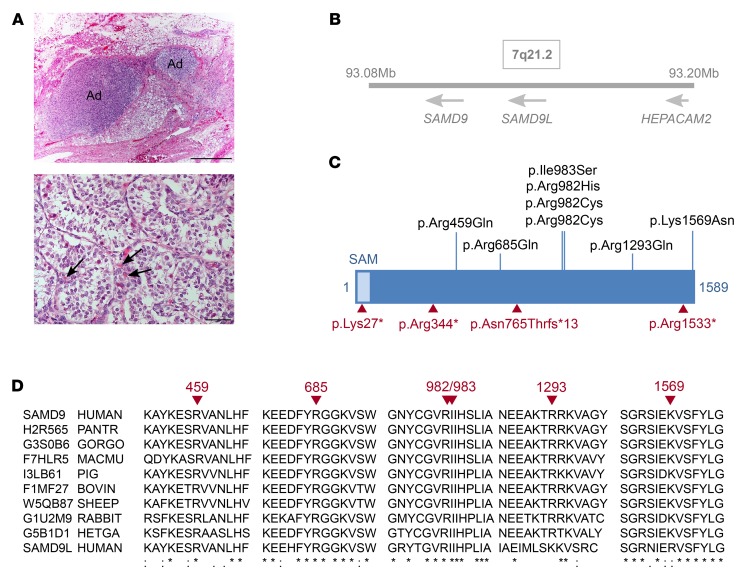
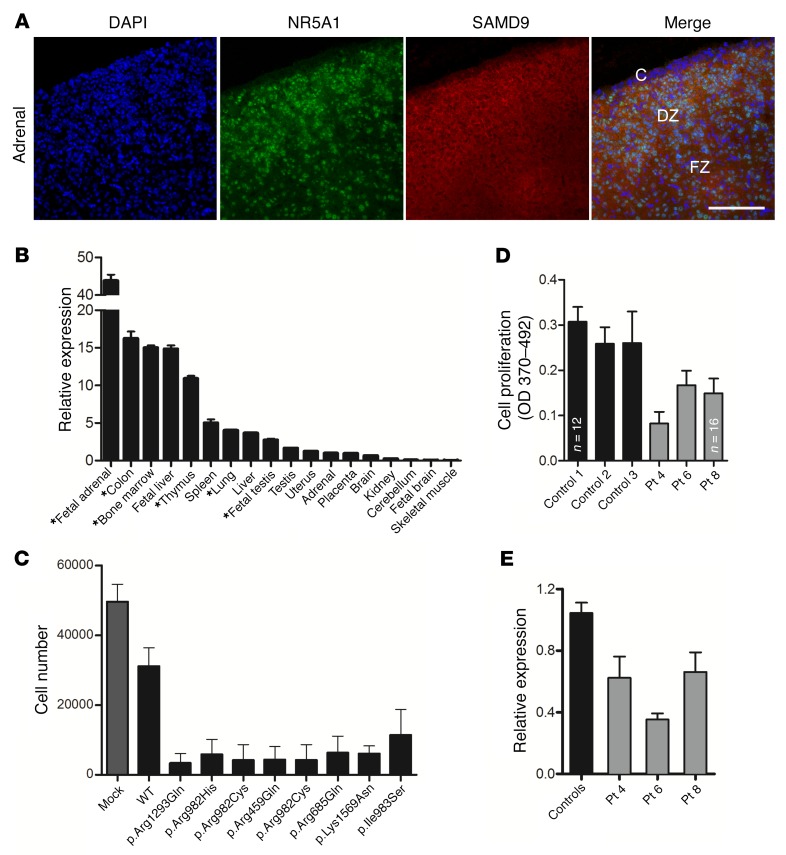
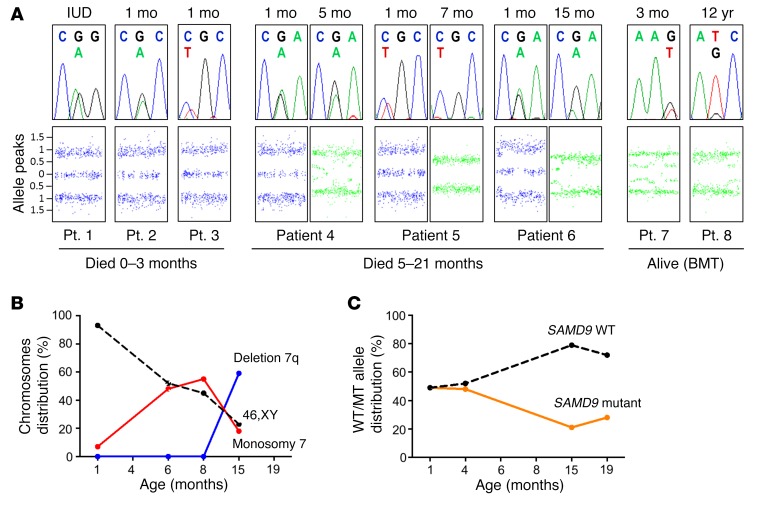
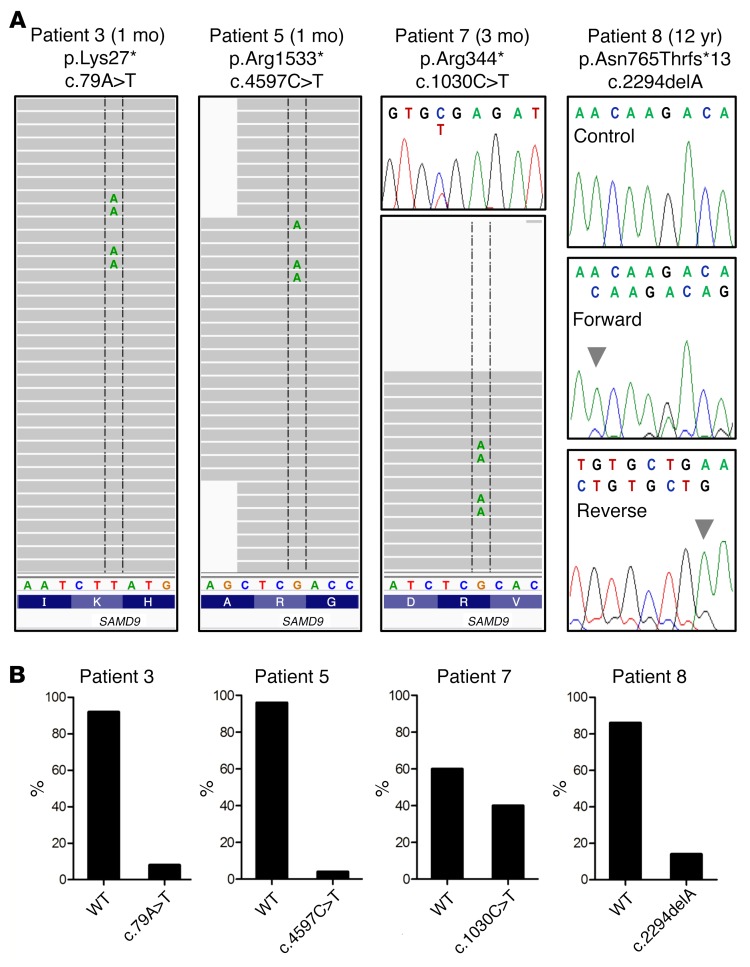
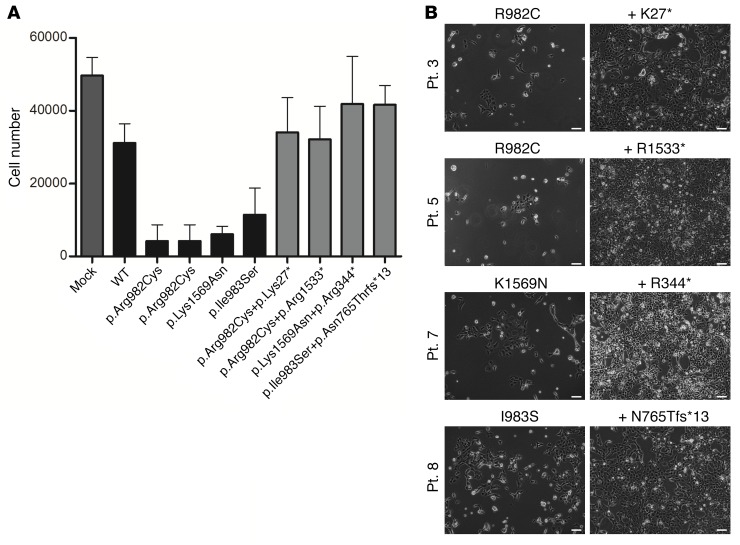
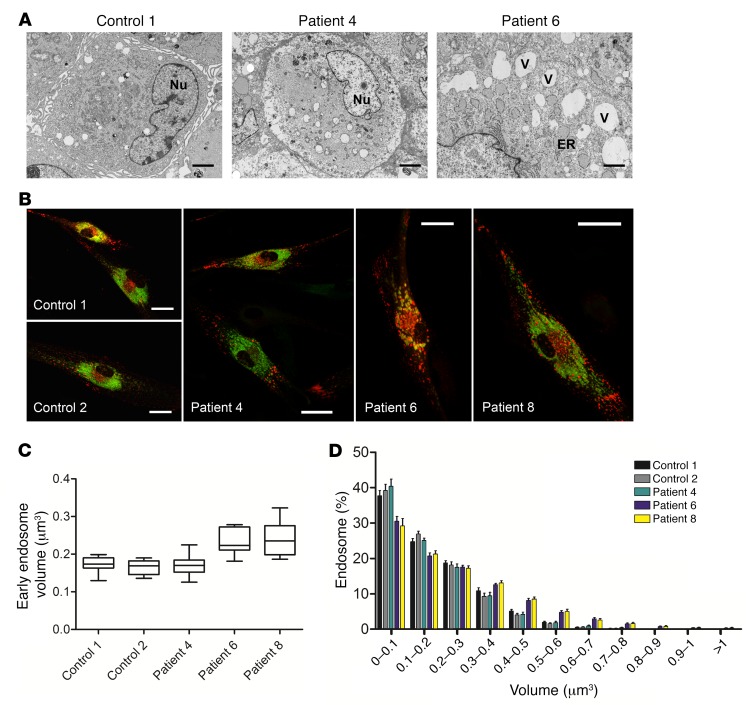
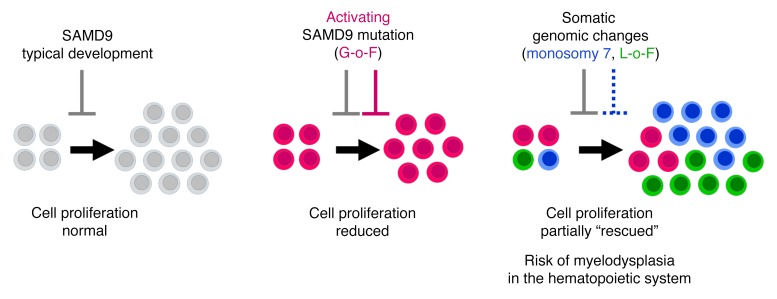
It is well established that somatic genomic changes can influence phenotypes in cancer, but the role of adaptive changes in developmental disorders is less well understood. Here we have used next-generation sequencing approaches to identify de novo heterozygous mutations in sterile α motif domain-containing protein 9 (SAMD9, located on chromosome 7q21.2) in 8 children with a multisystem disorder termed MIRAGE syndrome that is characterized by intrauterine growth restriction (IUGR) with gonadal, adrenal, and bone marrow failure, predisposition to infections, and high mortality. These mutations result in gain of function of the growth repressor product SAMD9. Progressive loss of mutated SAMD9 through the development of monosomy 7 (-7), deletions of 7q (7q-), and secondary somatic loss-of-function (nonsense and frameshift) mutations in SAMD9 rescued the growth-restricting effects of mutant SAMD9 proteins in bone marrow and was associated with increased length of survival. However, 2 patients with -7 and 7q- developed myelodysplastic syndrome, most likely due to haploinsufficiency of related 7q21.2 genes. Taken together, these findings provide strong evidence that progressive somatic changes can occur in specific tissues and can subsequently modify disease phenotype and influence survival. Such tissue-specific adaptability may be a more common mechanism modifying the expression of human genetic conditions than is currently recognized.


Conflict of interest statement

Conflict of interest: The authors have declared that no conflict of interest exists.

Figures

Figure 1
Figure 1. Mutations in SAMD9 identified in 8 patients with IUGR and a multisystem disorder.
(A) Adrenal and testis histology from patient 4. Top: Small islands of adrenal tissue (Ad) were identified in perinephric fat. Scale bar: 1 mm. Bottom: Testis showing rare Leydig cells (arrows) between seminiferous cords. Scale bar: 100 μm. (B) The location of SAMD9, SAMD9L, and HEPACAM2 on chromosome 7q21.2. (C) Mutations resulting in increased growth repression are shown in black. Acquired somatic loss-of-function mutations are shown in red. (D) Conservation of SAMD9 protein sequence in different species, with the position of mutated residues shown in red. Human SAMD9 is shown on top. Human SAMD9L is shown at the bottom.
Figure 2
Figure 2. SAMD9 is expressed in key tissues and represses cell growth.
(A) Immunohistochemistry showing SAMD9 expression in human fetal adrenal gland at 9 weeks postconception (red) with NR5A1 (also known as steroidogenic factor 1) shown in green and DAPI-stained nuclei in blue. C, capsule; DZ, definitive zone; FZ, fetal zone. Scale bar: 100 μm. (B) SAMD9 expression in different human fetal and adult tissues showing high expression in fetal adrenal as well as in tissues affected in the clinical phenotype. Tissues especially relevant to the phenotype are highlighted (*). Data are shown as relative expression compared with GAPDH. Representative data are shown as mean ± SEM for a single study performed with triplicate technical replicates. Similar patterns were seen in independent studies using both GAPDH and ACTB as housekeeping genes. (C) Growth of HEK293 cells was reduced following stable transfection of WT SAMD9 (mean ± SD; mock vs. WT, P < 0.001) and reduced further by the gain-of-function mutations found in patients (WT vs. samples, P < 0.0001, black bars). Data represent mean ± SD for the absolute cell number in 3 independent studies, each performed in triplicate (n = 9; 2-tailed t tests). (D) BrdU assays showing significantly reduced growth of patient fibroblasts (patients 4, 6, and 8) compared with fibroblasts from 3 independent controls. Data represent mean ± SD cell proliferation for 3 independent studies, each with 6 technical replicates (unless specified, n = 18; 1-way ANOVA with Tukey’s multiple comparison test, controls vs. patients, P < 0.001). (E) qRT-PCR analysis of fibroblast samples from 3 patients with a SAMD9 gene mutation revealed a significant reduction of gene expression compared with SAMD9 expression in fibroblasts derived from 3 healthy control individuals. Data represent mean ± SEM relative expression for 4 independent studies, each with 2 replicates (Mann-Whitney test, controls vs. patients, P < 0.05).
Figure 3
Figure 3. Acquired loss of chromosome 7 (–7) and its long arm (7q–) occurred in association with a reduction in the gain-of-function SAMD9 mutations.
(A) Chromatograms (top) from all 8 patients showing the SAMD9 mutations and a reduction in the mutant peak following development of monosomy 7 as shown by cytogenomic array (bottom). All samples are from peripheral leukocytes except the later sample in patient 4, which is from bone marrow DNA. Typical disomic chromosome 7 signal is shown in blue, whereas the signal with monosomy is shown in green. Data are presented in relation to length of survival. For patients 4–6 the earlier array is shown on the left and the later array on the right. The age at sampling is shown above the figure. BMT, bone marrow transplantation; IUD, intrauterine death; mo, months. (B) Serial cytogenetic data (leukocytes) from patient 6 showing the expansion of cells with –7 followed by their displacement by a 7q– clone removing the locus containing the SAMD9 gene. (C) Serial changes in the WT and mutant allele percentage (%) in patient 6 show that –7/7q– is associated with a reduction of the mutant SAMD9 allele, most likely due to the growth selection advantage of bone marrow cells that have lost the growth-repressing mutation. Data are derived from single-nucleotide primer extension assays for leukocyte DNA. A similar reduction in mutant allele was found in other patients who developed –7/7q– (patients 4 and 5) or who presented with a –7/7q– clone at the time of diagnosis of MDS (patients 7 and 8) (Table 1 and Supplemental Figures 3 and 4).
Figure 4
Figure 4. Additional loss-of-function mutations occurring in SAMD9.
(A) Low-copy-number nonsense (stop gain) mutations were found in 2 infants who died in the first year of life (patients 3 and 5). These changes were not seen on chromatograms but were detected by deep sequencing and by subcloning of DNA amplicons and sequencing of 50–100 clones. Both patients with a milder phenotype (patients 7 and 8) had loss-of-function mutations detected on chromatograms. A single nucleotide variant causing a nonsense mutation was found in patient 7 (chromatogram and deep sequencing reads shown). A single nucleotide deletion (arrowhead) causing a frameshift was found in patient 8. Control and patient forward sequence is shown in the upper panels and the patient’s reverse sequence shown below. Note: The reverse-direction nucleotide sequence is shown in the next-generation sequencing reads. Patient age at sampling is indicated. (B) Single-nucleotide primer extension assays confirming the WT and mutant allele percentage of additional SAMD9 loss-of-function changes in the patients described above.
Figure 5
Figure 5. Secondary loss-of-function mutations “rescue” the growth-repressive effects of SAMD9 gain-of-function mutations.
(A) The effects of the naturally occurring secondary nonsense or frameshift changes in the SAMD9 protein were studied in HEK293 cells in the same experiments as shown in Figure 2C. Addition of these secondary changes resulted in a loss of repressor activity (primary mutant vs. double mutant, all P < 0.0001, dark gray bars). Data represent mean ± SD for the absolute cell number in 3 independent studies, each performed in triplicate (n = 9; 2-tailed paired t test). (B) Representative images of cell density for the primary mutation (left column) and combined primary and secondary mutations (right column) for patients 3, 5, 7, and 8. Scale bars: 100 μm.
Figure 6
Figure 6. Analysis of the effect of SAMD9 mutations on cell structure and endosomes.
(A) Electron microscopy of fibroblasts from controls and patients showed a modest increase in the number and size of cytoplasmic vesicles (V) and mildly dilated rough endoplasmic reticulum (ER) in a small subpopulation of patient cells, but the effects were very heterogeneous (see also Supplemental Figure 7). Nu, nucleus. Scale bars: 2 μm. (B) Patient fibroblasts showing early endosomes (Rab5a, red) and late endosomes (Rab7a, green). Scale bars: 10 μm. (C) Early endosome volumes were greater in fibroblasts from patients 6 and 8 compared with controls, with greater variability in patients’ samples. Mean endosome volume for 10 independent cells was analyzed for each group. Data are shown as mean values with a whiskers plot to show the range (1-way ANOVA and Tukey’s post hoc test, P < 0.05). (D) A distribution analysis of early endosome volume for all cells studied also showed a shift toward larger early endosome volume for patients 6 and 8. Data are shown as mean ± SEM for 10 independent cells in each group. Mean number of endosomes quantified per cell, n = 2,248.
Figure 7
Figure 7. Effects of SAMD9 mutations on the derivation of fibroblasts into iPSCs and further differentiation into intermediate mesoderm.
(A) PluriTest analysis of the array data. Undifferentiated patient-derived iPSCs fall within the empirically set thresholds for pluripotent cells. The plot shows that the 2 patient lines (patients 6 and 8) and the normal control iPSC line cluster with pluripotent stem cells (red cloud) in contrast to the fibroblasts they originated from that cluster with partly reprogrammed or differentiated cells (blue clouds). Each circle represents 1 iPSC or fibroblast line. (B) iPSCs of both patients stained positive for the pluripotency markers NANOG, tumor rejection antigen 1-60 (TRA-1-60) (cell surface), stage-specific embryonic antigen 4 (SSEA4) (cell surface), and OCT3/4 (nuclear). Nuclei were counterstained with Hoechst 33342. Scale bars: 50 μm. (C) Hierarchical clustering of patient and control samples showing clustering by cell type (fibroblasts, iPSCs, intermediate mesoderm). Within each cell group, patient samples containing SAMD9 mutations grouped together. Functional enrichment analysis using DAVID showed potential changes in biologically relevant pathways in the 2 patient samples compared with control samples in the different cell lines (Supplemental Table 3).
Figure 8
Figure 8. Schematic diagram showing the effects of SAMD9 on cell proliferation during development.
During typical development, SAMD9 is a repressor that regulates controlled proliferation of cells (gray). Activation/gain-of-function (G-o-F) mutations in SAMD9 (pink) result in reduced proliferation of cells prior to differentiation, causing tissue hypoplasia. Secondary somatic changes in SAMD9 such as monosomy 7 (blue) or loss-of-function (L-o-F) mutations (green) remove the deleterious effect and allow partial rescue.

Similar articles

Cited by

References

    1. Lemos de Matos A, Liu J, McFadden G, Esteves PJ. Evolution and divergence of the mammalian SAMD9/SAMD9L gene family. BMC Evol Biol. 2013;13:121. - PMC - PubMed
    1. Li Q, et al. Mouse Samd9l is not a functional paralogue of the human SAMD9, the gene mutated in normophosphataemic familial tumoral calcinosis. Exp Dermatol. 2012;21(7):554–556. doi: 10.1111/j.1600-0625.2012.01524.x. - DOI - PMC - PubMed
    1. Jiang Q, et al. The Samd9L gene: transcriptional regulation and tissue-specific expression in mouse development. J Invest Dermatol. 2011;131(7):1428–1434. doi: 10.1038/jid.2011.61. - DOI - PMC - PubMed
    1. Ma Q, Yu T, Ren YY, Gong T, Zhong DS. Overexpression of SAMD9 suppresses tumorigenesis and progression during non small cell lung cancer. Biochem Biophys Res Commun. 2014;454(1):157–161. doi: 10.1016/j.bbrc.2014.10.054. - DOI - PubMed
    1. Li CF, et al. Human sterile alpha motif domain 9, a novel gene identified as down-regulated in aggressive fibromatosis, is absent in the mouse. BMC Genomics. 2007;8:92. - PMC - PubMed

Substances

Supplementary concepts