Meta-Analysis
. 2017 Feb 23;542(7642):433-438.
doi: 10.1038/nature21062. Epub 2017 Jan 25.

Prevalence and architecture of de novo mutations in developmental disorders

Collaborators
Meta-Analysis

Prevalence and architecture of de novo mutations in developmental disorders

Deciphering Developmental Disorders Study. Nature. .

Abstract

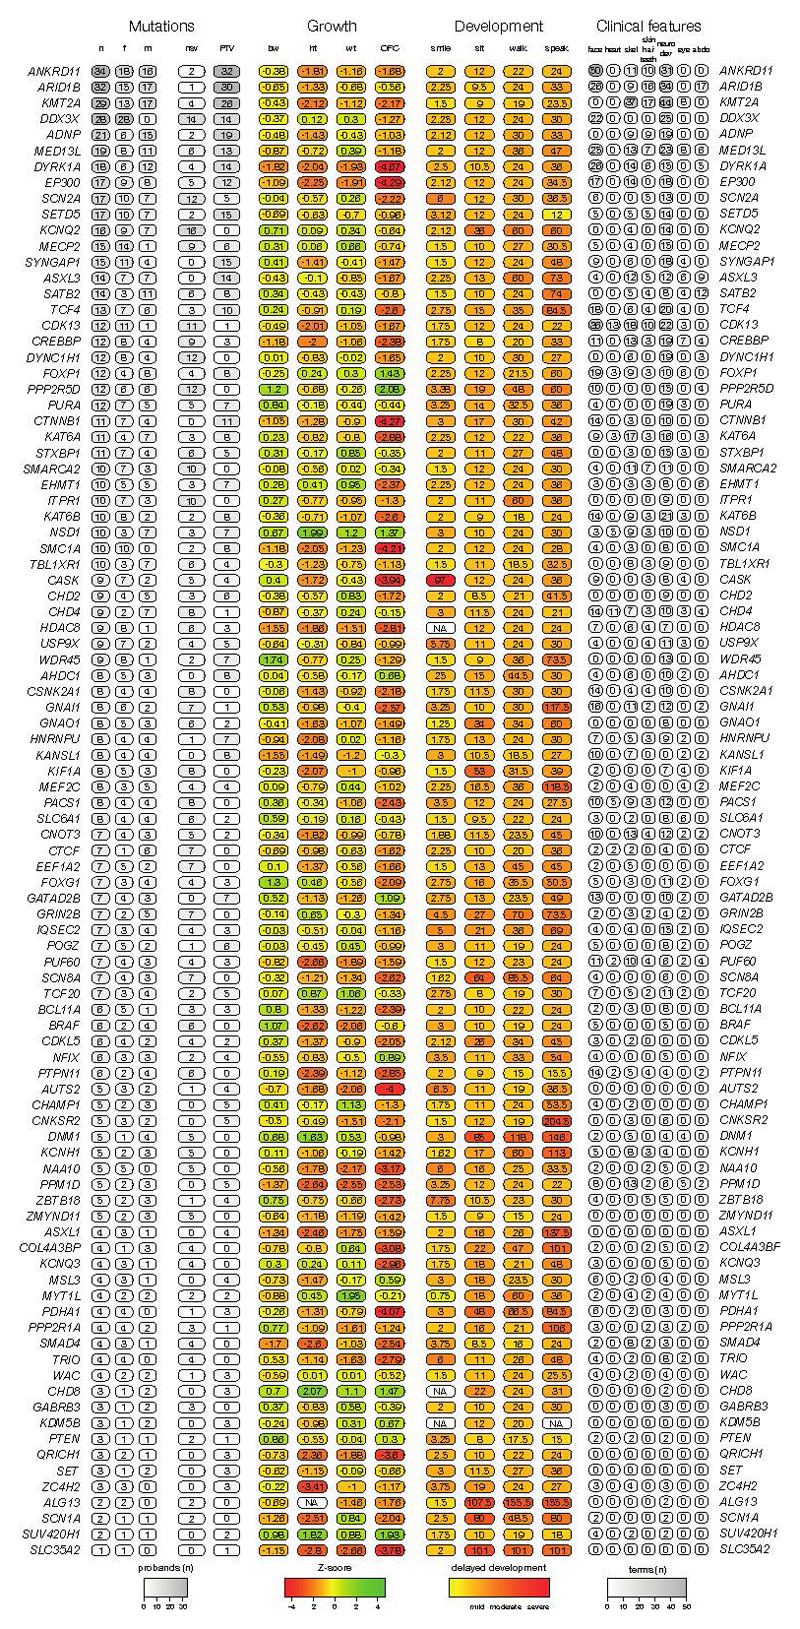
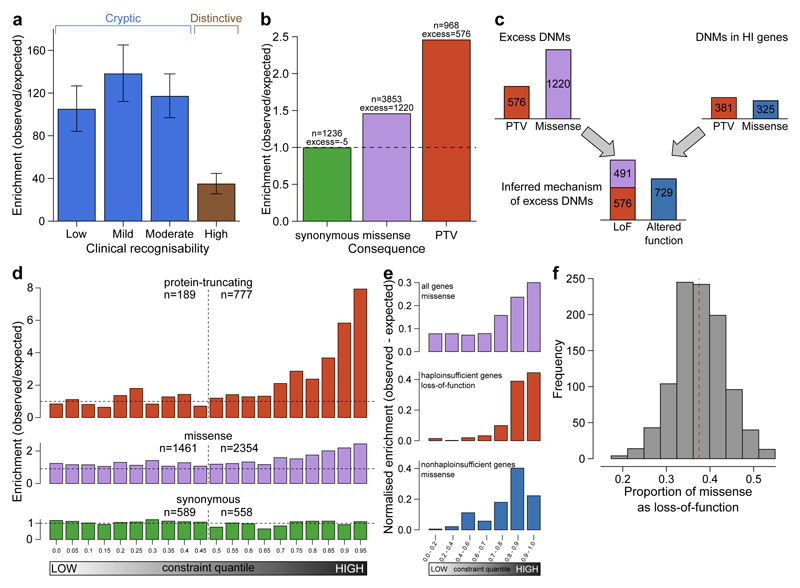
The genomes of individuals with severe, undiagnosed developmental disorders are enriched in damaging de novo mutations (DNMs) in developmentally important genes. Here we have sequenced the exomes of 4,293 families containing individuals with developmental disorders, and meta-analysed these data with data from another 3,287 individuals with similar disorders. We show that the most important factors influencing the diagnostic yield of DNMs are the sex of the affected individual, the relatedness of their parents, whether close relatives are affected and the parental ages. We identified 94 genes enriched in damaging DNMs, including 14 that previously lacked compelling evidence of involvement in developmental disorders. We have also characterized the phenotypic diversity among these disorders. We estimate that 42% of our cohort carry pathogenic DNMs in coding sequences; approximately half of these DNMs disrupt gene function and the remainder result in altered protein function. We estimate that developmental disorders caused by DNMs have an average prevalence of 1 in 213 to 1 in 448 births, depending on parental age. Given current global demographics, this equates to almost 400,000 children born per year.


Figures

Extended Data Figure 1
Proportion of individuals with a de novo mutation (DNM) likely to be pathogenic. These only included individuals with protein altering or protein truncating DNMs in dominant or X-linked dominant developmental disorder (DD) associated genes, or males with DNMs in hemizygous DD-associated genes. The proportions given are for those individuals with any DNMs rather than the total number of individuals in each subset. Cohorts included in the DNM meta-analyses are shaded blue.
Extended Data Figure 2
Phenotypic summary of genes without previous compelling evidence. Phenotypes are grouped by type. The first group indicates counts of individuals with DNMs per gene by sex (m: male, f: female), and by functional consequence (nsv: nonsynonymous variant, PTV: protein-truncating variant). The second group indicates mean values for growth parameters: birthweight (bw), height (ht), weight (wt), occipitofrontal circumference (OFC). Values are given as standard deviations from the healthy population mean derived from ALSPAC data. The third group indicates the mean age for achieving developmental milestones: age of first social smile, age of first sitting unassisted, age of first walking unassisted and age of first speaking. Values are given in months. The final group summarises Human Phenotype Ontology (HPO)-coded phenotypes per gene, as counts of HPO-terms within different clinical categories.
Extended Data Figure 3
Phenotypic summary of individuals with de novo mutations in genes achieving genomewide significance. Phenotypes are grouped by type. The first group indicates counts of individuals with DNMs per gene by sex (m: male, f: female), and by functional consequence (nsv: nonsynonymous variant, PTV: protein-truncating variant). The second group indicates mean values for growth parameters: birthweight (bw), height (ht), weight (wt), occipitofrontal circumference (OFC). Values are given as standard deviations from the healthy population mean derived from ALSPAC data. The third group indicates the mean age for achieving developmental milestones: age of first social smile, age of first sitting unassisted, age of first walking unassisted and age of first speaking. Values are given in months. The final group summarises Human Phenotype Ontology (HPO)-coded phenotypes per gene, as counts of HPO-terms within different clinical categories.
Extended Data Figure 4
Dispersion of de novo mutations and domains for each novel gene.a, CDK13, b, CHD4, c, CNOT3, d, CSNK2A1, e, GNAI1, f, KCNQ3, g, MSL3, h, PPM1D, I, PUF60, j, QRICH1, k, SET, l, SUV420H1, m, TCF20 and n, ZBTB18.
Extended Data Figure 5
Effect of clustering by phenotype on the ability to identify genomewide significant genes.a, Comparison of P-values derived from genotypic information alone versus P-values that incorporate genotypic information and phenotypic similarity. b, Comparison of P-values from tests in the complete DDD cohort versus tests in the subset with seizures. Genes that were previously linked to seizures are shaded blue. c, Proportion of cohort with a de novo mutation (DNM) in a seizure-associated gene, stratified by whether seizure-affected status. Bars indicate 95% CI. d, Comparison of power to identify genomewide significant genes in probands with seizures, versus the unstratified cohort, at matched sample sizes.
Extended Data Figure 6
Power of genome versus exome sequencing to discover dominant genes associated with developmental disorders. a, the number of genes exceeding genome-wide significance was estimated at three different fixed budgets (1 million (M) USD, 2M and 3M) and a range of relative sensitivities for genomes versus exomes to detect de novo mutations. The number of genes identifiable by exome sequencing are shaded blue, whereas the number of genes identifiable by genome sequencing are shaded green. The regions where exome sequencing costs 30-40% of genome sequencing are shaded with a grey background, which corresponds to the price differential in 2016. b, simulated estimates of power to detect loss-of-function genes in the genome at different cohort sizes, given fixed budgets.
Extended Data Figure 7
Gene-wise significance of neurodevelopmental genes versus the expected number of mutations per gene. Points are shaded by clinical recognisability classification. Genes have been separated into two plots, one plot with genes for cryptic disorders with low, mild or moderate clinical recognisability, and one plot with genes for distinctive disorders with high clinical recognisability.
Extended Data Figure 8
Stringency of de novo mutation (DNM) filtering. a, Sensitivity and specificity of DNM validations within sets filtered on varying thresholds of DNM quality (posterior probability of DNM). The analysed DNMs were restricted to sites identified within the earlier 1133 trios, where all candidate DNMs underwent validation experiments. The labelled value is the quality threshold at which the number of candidate synonymous DNMs equals the number of expected synonymous mutations under a null germline mutation rate. b, Excess of missense and loss-of-function DNMs at varying DNM quality thresholds. The DNM excess is adjusted for the sensitivity and specificity at each threshold.
Extended Data Figure 9
Enrichment of de novo mutations by consequence type, across RVIS functional constraint quantiles. A comparison of enrichment for RVIS values generated from ESP6500 data versus ExAC data is provided.
Figure 1
Figure 1
Association of phenotypes with presence of likely pathogenic de novo mutations (DNMs). Association of phenotypes with presence of likely pathogenic de novo mutations (DNMs). a, Odds ratios for binary phenotypes. Positive odds ratios are associated with increased risk of pathogenic DNMs when the phenotype is present. P-values are given for a Fisher’s Exact test. b, Beta coefficients from logistic regression of quantitative phenotypes versus presence of a pathogenic DNM. All phenotypes aside from length of autozygous regions were corrected for gender as a covariate. The developmental milestones (age to achieve first words, walk independently, sit independently and social smile) were log-scaled before regression. The growth parameters (height, birthweight and occipitofrontal circumference (OFC)) were evaluated as absolute distance from the median. c, Relationship between length of autozygous regions chance of having a pathogenic DNM. The regression line is plotted as the dark gray line. The 95% confidence interval for the regression is shaded gray. The autozygosity lengths expected under different degrees of consanguineous unions are shown as vertical dashed lines. n, number of individuals in each autozygosity group. d, Relationship between age of fathers at birth of child and number of high confidence DNMs. n, number of high confidence DNMs. e, Relationship between age of mothers at birth of child and number of high confidence DNMs. Error bars indicate 95% c.i. n, number of high confidence DNMs.
Figure 2
Figure 2
Genes exceeding genome-wide significance. Manhattan plot of combined P-values across all tested genes. The red dashed line indicates the threshold for genome-wide significance (P < 7 x 10⁻⁷). Genes exceeding this threshold have HGNC symbols labelled. De-identified realistic average (‘composite’) faces were generated using previously validated software from clinical photos from individuals with DNMs in the same gene, and are shown here for the six most-significantly associated genes. Confirmation of de-identification was performed by careful review by two experienced clinical geneticists. Each face was generated from clinical photos of more than ten children.
Figure 3
Figure 3
Excess of de novo mutations (DNMs). a, Enrichment ratios of observed to expected loss-of-function DNMs by clinical recognisability for dominant haploinsufficient neurodevelopmental genes as judged by two consultant clinical geneticists. Error bars indiciate 95% CI. b, Enrichment of DNMs by consequence normalised relative to the number of synonymous DNMs. c, Proportion of excess DNMs with loss-of-function or altered-function mechanisms. Proportions are derived from numbers of excess DNMs by consequence, and numbers of excess truncating and missense DNMs in dominant haploinsufficient genes. d, Enrichment ratios of observed to expected DNMs by pLI constraint quantile for loss-of-function, missense and synonymous DNMs. Counts of DNMs in each lower and upper half of the quantiles are provided. e, Normalised excess of observed to expected DNMs by pLI constraint quantile. This includes missense DNMs within all genes, loss-of-function including missense DNMs in dominant haploinsufficient genes and missense DNMs in dominant nonhaploinsufficient genes (genes with dominant negative or activating mechanisms). f, Proportion of excess missense DNMs with a loss-of-function mechanism. The red dashed line indicates the proportion in observed excess DNMs at the optimal goodness-of-fit. The histogram shows the frequencies of estimated proportions from 1000 permutations, assuming the observed proportion is correct.
Figure 4
Figure 4
Prevalence of live births with developmental disorders caused by dominant de novo mutations (DNMs). The prevalence within the general population is provided as percentage for combinations of parental ages, extrapolated from the maternal and paternal rates of DNMs. Distributions of parental ages within the DDD cohort and the UK population are shown at the matching parental axis.

Similar articles

Cited by

References

    1. Sheridan E, et al. Risk factors for congenital anomaly in a multiethnic birth cohort: an analysis of the Born in Bradford study. Lancet. 2013;382:1350–9. - PubMed
    1. Ropers HH. Genetics of early onset cognitive impairment. Annu Rev Genomics Hum Genet. 2010;11:161–87. - PubMed
    1. De Ligt J, et al. Diagnostic exome sequencing in persons with severe intellectual disability. The New England Journal of Medicine. 2012;367:1921–9. - PubMed
    1. De Rubeis S, et al. Synaptic, transcriptional and chromatin genes disrupted in autism. Nature. 2014;515:209–215. - PMC - PubMed
    1. Epi4K Consortium & Epilepsy Phenome/Genome Project. De novo mutations in epileptic encephalopathies. Nature. 2013;501:217–21. - PMC - PubMed

Publication types

MeSH terms

Substances