. 2017 Feb 3;292(5):1785-1797.
doi: 10.1074/jbc.M116.745448. Epub 2016 Dec 19.

Signal Transducer and Activator of Transcription 1 Plays a Pivotal Role in RET/PTC3 Oncogene-induced Expression of Indoleamine 2,3-Dioxygenase 1

Affiliations

Signal Transducer and Activator of Transcription 1 Plays a Pivotal Role in RET/PTC3 Oncogene-induced Expression of Indoleamine 2,3-Dioxygenase 1

Sonia Moretti et al. J Biol Chem. .

Abstract

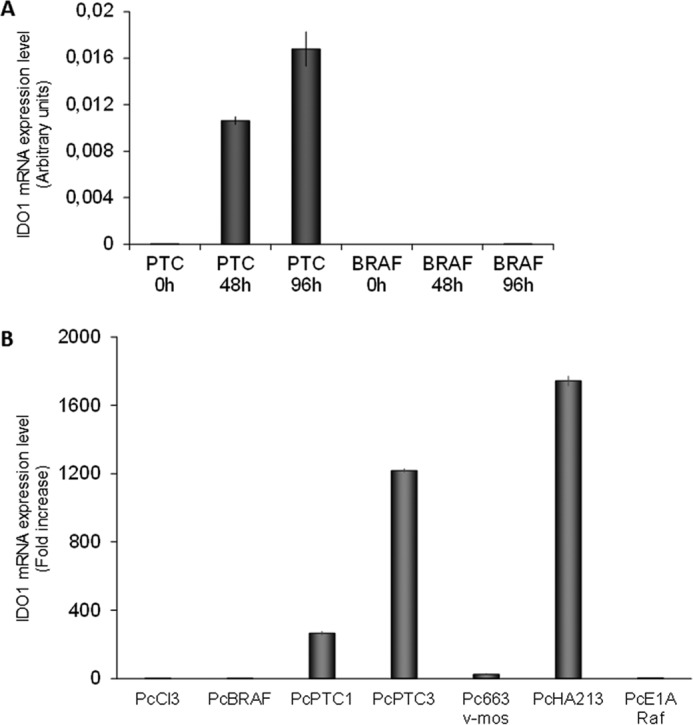
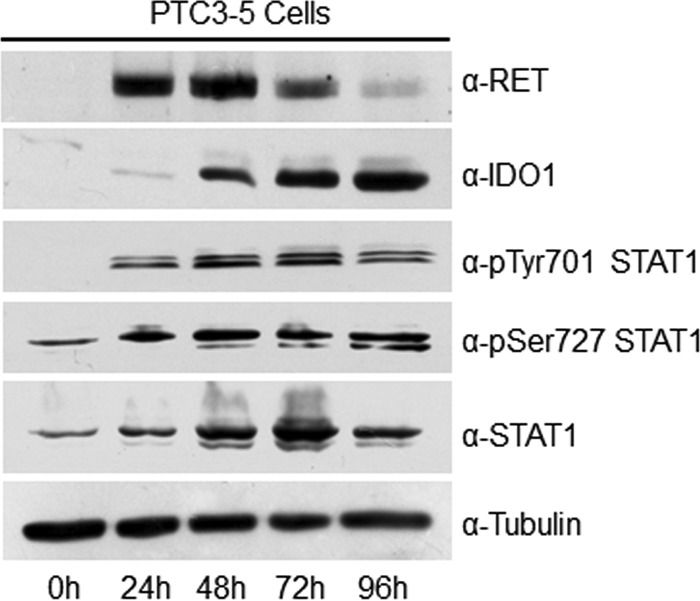
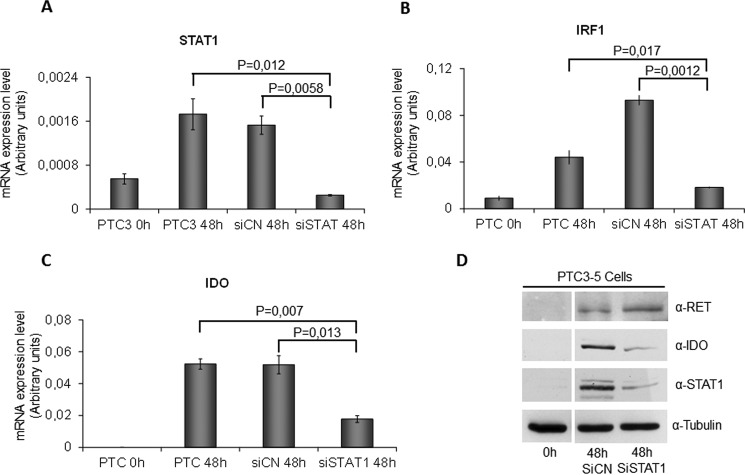
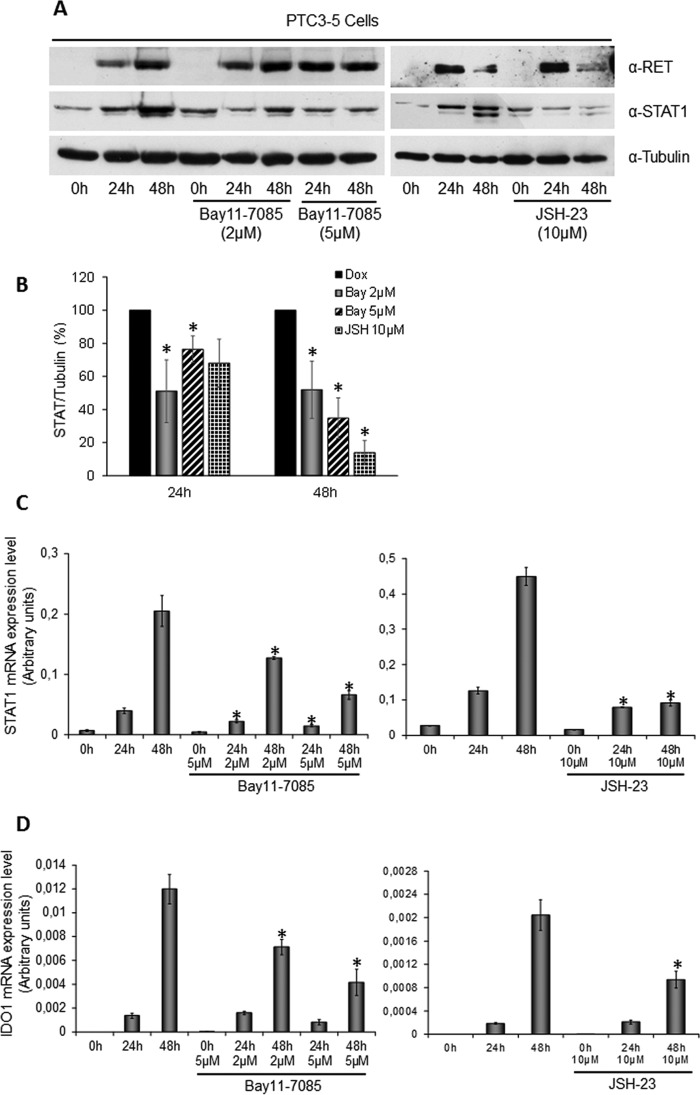
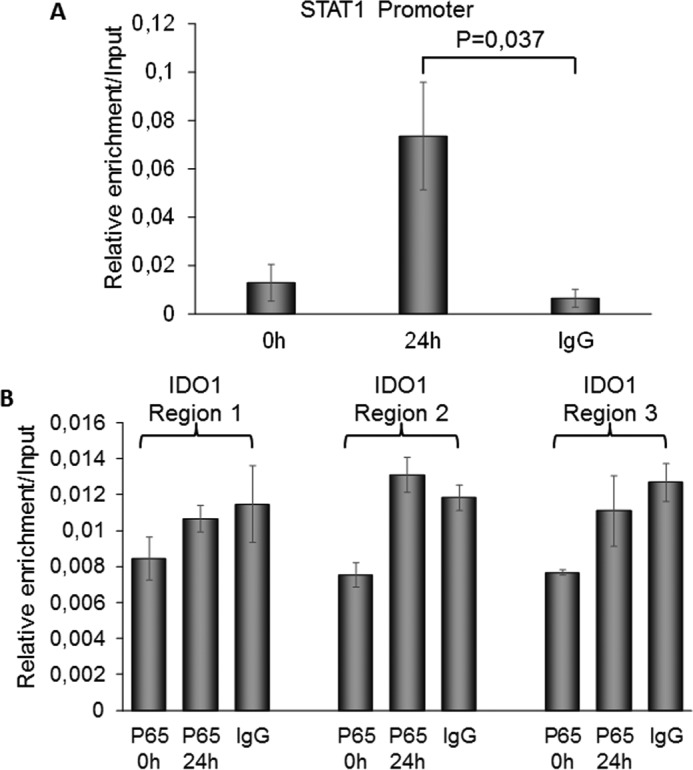
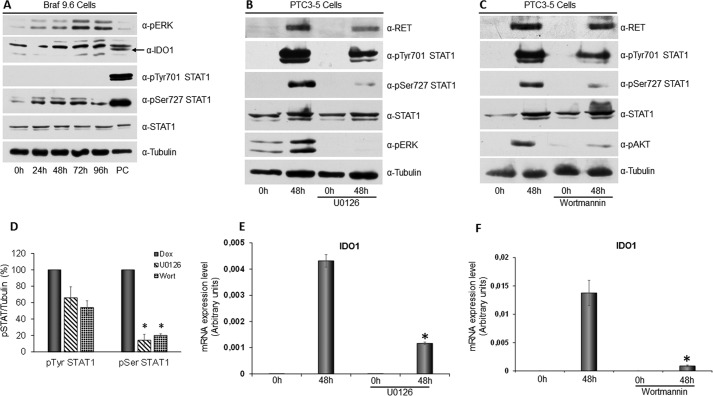
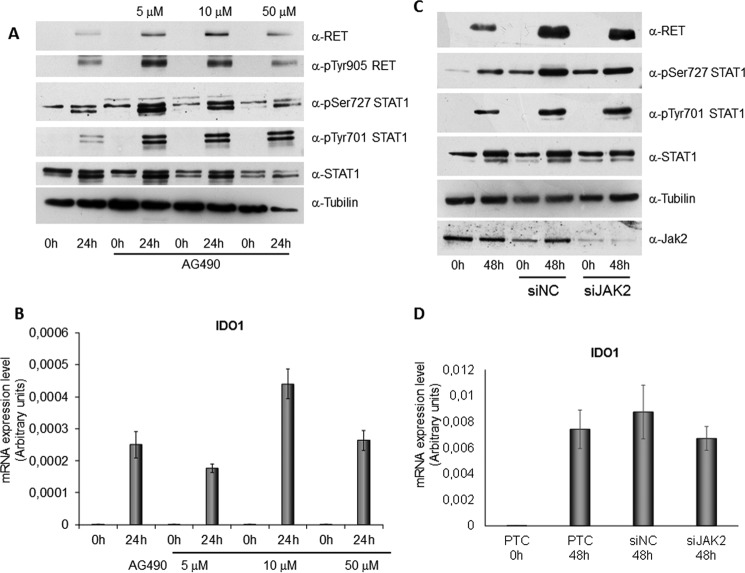
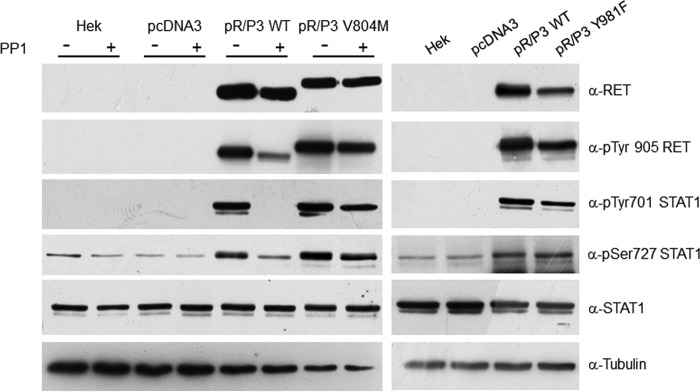
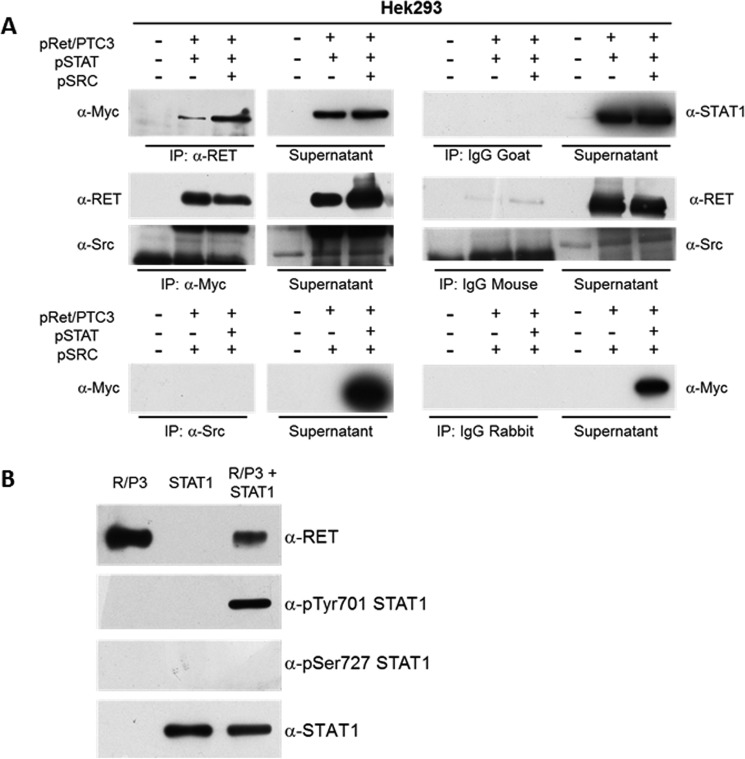
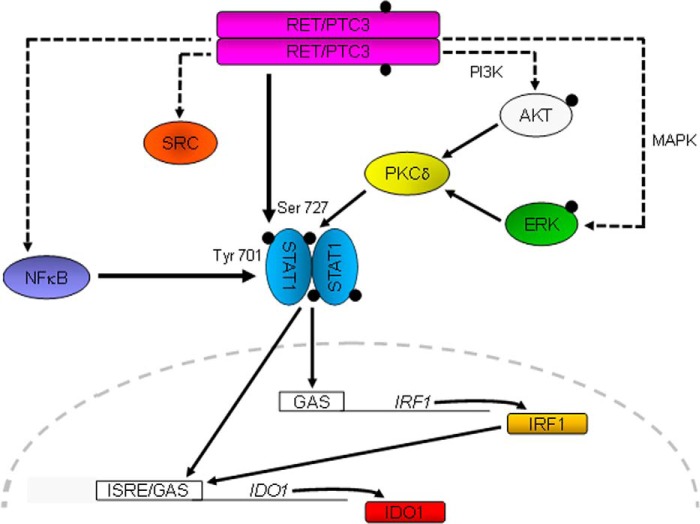
Indoleamine 2,3-dioxygenase 1 (IDO1) is a single chain oxidoreductase that catalyzes tryptophan degradation to kynurenine. In cancer, it exerts an immunosuppressive function as part of an acquired mechanism of immune escape. Recently, we demonstrated that IDO1 expression is significantly higher in all thyroid cancer histotypes compared with normal thyroid and that its expression levels correlate with T regulatory (Treg) lymphocyte densities in the tumor microenvironment. BRAFV600E- and RET/PTC3-expressing PcCL3 cells were used as cellular models for the evaluation of IDO1 expression in thyroid carcinoma cells and for the study of involved signal transduction pathways. BRAFV600E-expressing PcCL3 cells did not show IDO1 expression. Conversely, RET/PTC3-expressing cells were characterized by a high IDO1 expression. Moreover, we found that, the STAT1-IRF1 pathway was instrumental for IDO1 expression in RET/PTC3 expressing cells. In detail, RET/PTC3 induced STAT1 overexpression and phosphorylation at Ser-727 and Tyr-701. STAT1 transcriptional regulation appeared to require activation of the canonical NF-κB pathway. Conversely, activation of the MAPK and PI3K-AKT pathways primarily regulated Ser-727 phosphorylation, whereas a physical interaction between RET/PTC3 and STAT1, followed by a direct tyrosine phosphorylation event, was necessary for STAT1 Tyr-701 phosphorylation. These data provide the first evidence of a direct link between IDO1 expression and the oncogenic activation of RET in thyroid carcinoma and describe the involved signal transduction pathways. Moreover, they suggest possible novel molecular targets for the abrogation of tumor microenvironment immunosuppression. The detection of those targets is becoming increasingly important to yield the full function of novel immune checkpoint inhibitors.

Keywords: cancer; cell signaling; indoleamine-pyrrole 2,3-dioxygenase (IDO1); interferon regulatory factor (IRF); signal transducers and activators of transcription 1 (STAT1).


Conflict of interest statement

The authors declare that they have no conflicts of interest with the contents of this article

Figures

FIGURE 1.
FIGURE 1.
IDO1 expression in PcCL3 cells expressing BRAFV600E or RET/PTC3 oncogenes. A, PTC3–5 cells and BRAF9.6 were incubated with Dox (1 μg/ml) for the indicated times and harvested for total RNA extraction. After total RNA extraction and cDNA synthesis, IDO1 mRNA expression levels were assayed by quantitative PCR. The data are presented as means of arbitrary units. In BRAF9.6 cells Dox treatment for 48 and 96 h did not elicit any up-regulation of IDO1 mRNA expression. Conversely, in PTC3–5 cells induction of RET/PTC3 for the same time was associated with a significant increase of IDO1 mRNA expression. The experiment was repeated three times in triplicate and the more representative result is depicted. B, PcCL3-derived cell lines stably expressing, respectively, BRAFV600E (PcBRAF), RET/PTC1 (PcPTC1), RET/PTC3 (PcPTC3), v-Mos (Pc663), RET/PTC1 and H-RasG12V (PcHA213), and v-Raf (PcE1ARaf) oncogenes were harvested for total RNA extraction. After total RNA extraction and cDNA synthesis, IDO1 mRNA expression levels were assayed by quantitative PCR. Cells expressing RET/PTC1 and RET/PTC3 showed very high IDO1 expression levels compared with PcCL3 cells, whereas mRNA of the immunomodulatory molecule was barely detectable in the other cell lines. The data are presented as relative quantification compared with PcCL3 parental cells. The experiment was repeated two times in triplicate and the results are presented as mean ± S.D. (error bars) of the obtained data.
FIGURE 2.
FIGURE 2.
RET/PTC3 regulates STAT1 activation. PTC3–5 cell line was incubated with Dox (1 μg/ml) for the indicated times and harvested for cell lysate preparation. Expression of RET, IDO1, pTyr-701 STAT1, pSer-727 STAT1, total STAT1, and tubulin were assayed by immunoblot. RET/PTC3 induced both the up-regulation of STAT1 expression and its full activation through the simultaneous phosphorylation of Tyr-701 and Ser-727. Analysis of IDO1 confirmed RET/PTC3-induced IDO1 overexpression also as protein. All the experiments were repeated twice and the more representative results are depicted.
FIGURE 3.
FIGURE 3.
STAT1 silencing impairs RET/PTC-induced IRF1 and IDO1 overexpression. PTC3–5 cells were transfected with rat STAT1 siRNA (25 nm) (siSTAT1) or with non-target siRNA (25 nm) (siNC). Twenty-four hours after transfection, cells were stimulated with Dox (1 μg/ml) for 48 h before cell harvesting for total RNA and cell lysate preparation. After total RNA extraction and cDNA synthesis, STAT1 (A), IRF1 (B), and IDO1 (C) mRNA expression levels were evaluated by quantitative PCR. STAT1, IRF1, and IDO1 mRNA expression resulted significantly in impaired STAT1-silenced cells compared with controls. The quantitative PCR data are presented as means of arbitrary units. D, immunoblottings for RET, IDO1, total STAT1, and tubulin were performed. In STAT1-silenced cells, despite a comparable expression of RET/PTC3, STAT1 and IDO1 protein expression was significantly impaired compared with controls. All experiments were repeated twice and the more representative results are depicted. p values were calculated applying the two-tailed unpaired Student's t test.
FIGURE 4.
FIGURE 4.
RET/PTC3-induced activation of canonical NF-κB pathway is involved in STAT1 and IDO1 gene expression. PTC3–5 cells were incubated with Dox (1 μg/ml) for the indicated times in the presence or absence of the NF-κB inhibitors Bay11-7085 (2 and 5 μm) or JSH-23 (10 μm) and harvested for cell lysate preparation or total RNA extraction and cDNA synthesis. A, immunoblottings for RET, STAT1, and tubulin were performed and B, the bands of three independent experiments were analyzed by densitometry and normalized with tubulin. Inhibition of canonical NF-κB pathway or inhibition of p65 nuclear translocation down-regulated STAT1 expression in a statistically significant manner. C, STAT1 mRNA expression levels were assayed by quantitative PCR. D, IDO1 mRNA expression levels were assayed by quantitative PCR. The data are presented as means of arbitrary units. Inhibition of the canonical NF-κB pathway or inhibition of p65 nuclear translocation down-regulated STAT1 and IDO1 mRNA expression. All experiments were repeated three times and the more representative results are depicted. p values were calculated applying the two-tailed unpaired Student's t test. *, p < 0.05.
FIGURE 5.
FIGURE 5.
RelA/p65 regulates STAT1 but not IDO1 gene expressions. PTC3–5 cells were incubated with Dox (1 μg/ml) for 24 h to induce RET/PTC3 oncogene expression. Analysis of STAT1 and IDO1 promoters using MatInspector software allowed detection of one NF-κB binding region for STAT1 and three NF-κB binding regions for IDO1. A ChIP assay was performed using an anti-p65 antibody after dual cross-linking of the cells and the isolated DNA was amplified by Q-PCR using specific primers spanning the detected putative NF-κB binding regions of STAT1 and IDO1 genes. A, STAT1 promoter ChIP analysis showed a significant enrichment of the putative NF-κB binding region in p65 IP after 24 h of oncogene expression compared with control (IgG IP). B, IDO1 promoter ChIP analysis did not show any significant enrichment of the three putative NF-κB binding regions in p65 IP after 24 h of oncogene expression compared with control (IgG IP). The results are presented as mean ± S.D. of three independent experiments. p values were calculated applying the two-tailed unpaired Student's t test.
FIGURE 6.
FIGURE 6.
STAT1 Ser-727 phosphorylation depends on activation of the MAPK and PI3K pathways. A, BRAF9.6 cell line was incubated with Dox (1 μg/ml) for the indicated times and harvested for cell lysate preparation. Immunoblottings for pERK, IDO1, pTyr-701 STAT1, pSer-727 STAT1, total STAT1, and tubulin were performed. BRAFV600E expression only induced phosphorylation of serine 727 without affecting tyrosine 701 phosphorylation and STAT1 and IDO1 expression levels (PC: positive control). B, PTC3–5 cells were incubated with Dox (1 μg/ml) for the indicated times in the presence or absence of the MEK inhibitor U0126 (10 μm) and harvested for cell lysate preparation. Immunoblottings for RET, pTyr-701 STAT1, pSer-727 STAT1, total STAT1, pERK, and tubulin were performed. Inhibition of RET/PTC3-induced activation of the MAPK pathway appeared to strongly inhibit STAT1 serine 727 phosphorylation and, to a lower extent, STAT1 tyrosine 701 phosphorylation, without affecting the expression levels of the transcription factor. C, PTC3–5 cells were incubated with Dox (1 μg/ml) for the indicated times in the presence or absence of the PI3K inhibitor wortmannin (0.3 μm) and harvested for cell lysate preparation. Immunoblottings for RET, pTyr-701 STAT1, pSer-727 STAT1, total STAT1, pAKT, and tubulin were performed. Inhibition of RET/PTC3-induced activation of the PI3K pathway appeared to inhibit significantly STAT1 serine 727 phosphorylation and, to a lower extent, STAT1 tyrosine 701 phosphorylation, without affecting the expression levels of the transcription factor. D, the STAT1 pTyr-701 and pSer-727 bands of three independent experiments were analyzed by densitometry and normalized toward tubulin. The results indicate that either the MAPK or PI3K pathway inhibition cause a not significant light reduction of STAT1 tyrosine 701 phosphorylation, but a statistically significant strong reduction of STAT1 serine 727 phosphorylation. E, PTC3–5 cells were incubated with Dox (1 μg/ml) for the indicated times in the presence or absence of the MEK inhibitor U0126 (10 μm) and harvested for total RNA preparation. After total RNA extraction and cDNA synthesis, IDO1 mRNA expression levels were assayed by quantitative PCR. The data are presented as means of arbitrary units. Inhibition of RET/PTC3-induced activation of the MAPK pathway appeared to strongly inhibit IDO1 mRNA expression (*, p = 0.0022). F, PTC3–5 cells were incubated with Dox (1 μg/ml) for the indicated times in the presence or absence of the PI3K inhibitor wortmannin (0,3 μm) and harvested for total RNA preparation. After total RNA extraction and cDNA synthesis, IDO1 mRNA expression levels were assayed by quantitative PCR. The data are presented as means of arbitrary units. Inhibition of RET/PTC3-induced activation of the PI3K pathway appeared to strongly inhibit IDO1 mRNA expression (*, p = 0.01). All experiments were repeated twice and the more representative results are depicted. p values were calculated applying the two-tailed unpaired Student's t test.
FIGURE 7.
FIGURE 7.
JAK2 does not mediate RET/PTC3-induced activation of STAT1. PTC3–5 cell line was incubated with Dox (1 μg/ml) or with Dox (1 μg/ml) and JAK2 inhibitor AG490 (5, 10, and 50 μm) for 24 h and harvested for cell lysate preparation or for total RNA extraction and cDNA synthesis. A, immunoblottings for RET, pTyr-905 RET, pSer-727 STAT1, pTyr-701 STAT1, total STAT1, and tubulin were performed. Treatment with AG490 did not appear to influence RET activation and STAT1 phosphorylation and expression. B, IDO1 mRNA expression levels were assayed by quantitative PCR. The data are presented as means of arbitrary units. Inhibition of JAK2 did not significantly influence IDO1 expression. C, the PTC3–5 cell line was transfected with rat JAK2 siRNA (50 nm) (siJAK2) or with non-target siRNA (50 nm) (siNC). Twenty-four hours after transfection, cells were stimulated with Dox (1 μg/ml) for 48 h before cell harvesting for RNA and cell lysate preparation. Immunoblottings for RET, pTyr-701 STAT1, pSer-727 STAT1, total STAT1, JAK2, and tubulin were performed. JAK2 silencing did not appear to influence RET activation and STAT1 phosphorylation and expression. D, IDO1 mRNA expression levels were assayed by quantitative PCR. The data are presented as means of arbitrary units. Silencing of JAK2 did not significantly influence IDO1 expression. All the experiments were repeated twice and the more representative results are depicted.
FIGURE 8.
FIGURE 8.
Src does not mediate RET/PTC3-induced activation of STAT1. HEK293T cells, transiently transfected with pcDNA3, pcDNA3-RET/PTC3 WT, and the mutant pcDNA3-RET/PTC3-V804M Myc-tagged, were treated with the Src inhibitor PP1 (5 μm) for 24 h and harvested for cell lysate preparation. Immunoblotting for RET, pTyr-905 RET, pTyr-701 STAT1, pSer-727 STAT1, total STAT1, and tubulin were performed. Treatment with PP1 caused a marked reduction of RET Tyr-905 and STAT1 Tyr-701 phosphorylations in cells transfected with RET/PTC WT (pR/P3 WT), but not in cells transfected with the mutant RET/PTC3-V804M (pR/P3 V804M), which is resistant to PP1. Furthermore, HEK293T cells were transiently transfected with pcDNA3, pcDNA3-RET/PTC3 WT, and the mutant pcDNA3-RET/PTC3-Y918F, which is unable to bind Src, and harvested for cell lysate preparation, 24 h after transfection. Immunoblotting for RET, pTyr-905 RET, pTyr-701 STAT1, pSer-727 STAT1, total STAT1, and tubulin were performed. In cells transfected whit RET/PTC3-Y918F (pR/P3 Y918F) phosphorylation of STAT1 Tyr-701 was superimposable to that of RET/PTC3 WT (pR/P3 WT). These results indicate that Src is not involved in RET/PTC3-induced STAT1 Tyr-701 phosphorylation. All the experiments were repeated twice and the more representative results are depicted.
FIGURE 9.
FIGURE 9.
RET/PTC3 interacts with STAT1 and phosphorylates STAT1 on Tyr-701. A, co-immunoprecipitation experiment in HEK293T cells. HEK293T cells were transiently co-transfected with expression vectors for RET/PTC3 and Myc-tagged STAT1 or RET/PTC3 and Src or RET/PTC3, Myc-tagged STAT1 and Src. Twenty-four hours after transfection, cells were harvested for cell lysate preparation. Five hundred μg of total lysate were immunoprecipitated (IP) using an anti-RET antibody or an anti-Myc antibody (used for STAT1 IP) or an anti-Src antibody. Immunoprecipitates were then subjected to Western blotting using the anti-Myc antibody in RET IP, the anti-RET and anti-Src antibodies in STAT1 IP, and the anti-Myc antibody in Src IP. To verify binding specificity, the presence of STAT1, RET, and Src was searched on the protein complexes immunoprecipitated with normal goat (control of RET IP), normal mouse (control of Myc IP), or normal rabbit (control of Src IP) IgG mixtures. Immunoprecipitation of RET allowed a specific co-immunoprecipitation of STAT1 in the cells expressing RET/PTC3 and STAT1 or RET/PTC3, STAT1, and Src. Similarly, immunoprecipitation of STAT1 (with an anti-Myc antibody) allowed a specific co-immunoprecipitation of RET in the cells expressing RET/PTC3 and STAT1 or RET/PTC3, STAT1, and Src. Conversely, Src was not detected in the STAT1 IP and STAT1 could not be found in Src IP. These data indicate that STAT1 and RET/PTC3 aggregate one with the other, whereas Src and STAT1 do not. B, RET/PTC3 in vitro kinase assay. HEK293T cells were transiently transfected with expression vector for RET/PTC3 or Myc-tagged STAT1. Twenty-four hours after transfection, cells were harvested for cell lysate preparation. Five hundred μg of total lysate were immunoprecipitated using an anti-RET antibody or an anti-Myc antibody (used for STAT1 IP). The two IPs were pulled together and resuspended in kinase buffer. The reaction was carried out for 30 min at 30 °C and stopped by adding Laemmli buffer. The kinase reactions were submitted to Western blotting and the presence of RET, pTyr-701 STAT1, pSer-727 STAT1, and total STAT1 were assayed using the specific antibodies. RET/PTC3 phosphorylated STAT1 Tyr-701, but not STAT1 Ser-727. Furthermore, RET/PTC3 and STAT1 were incubated alone in the kinase buffer. No evidence of RET/PTC3-driven pulldown of phosphorylated STAT1 from HEK293T cell lysates or STAT1 autophosphorylation could be detected. All experiments were repeated twice and the more representative results are depicted.
FIGURE 10.
FIGURE 10.
Proposed mechanism whereby RET/PTC3 regulates IDO1 expression in thyroid cancer cells. RET/PTC3 induces STAT1 expression through activation of the canonical NF-κB pathway. The activation of STAT1 is achieved by phosphorylation of Ser-727 and Tyr-701. RET/PTC3 induces phosphorylation of Ser-727 through activation of the MAPK and PI3K pathways, via PKCδ (23, 24); whereas RET/PTC3 phosphorylates STAT1 Tyr-701 directly. STAT1 translocates into the nucleus and induces the expression of IRF1. STAT1 and IRF1 bind to ISRE/GAS elements on the IDO1 promoter and promote the expression of the immunomodulatory enzyme. Activation of the canonical NF-κB pathway does not appear to modulate directly IDO1 gene expression.

Similar articles

Cited by

References

    1. Hanahan D., and Weinberg R. A. (2011) Hallmarks of cancer: the next generation. Cell 144, 646–674 - PubMed
    1. Gajewski T. F., Schreiber H., and Fu Y. X. (2013) Innate and adaptive immune cells in the tumor microenvironment. Nat. Immunol. 14, 1014–1022 - PMC - PubMed
    1. Uyttenhove C., Pilotte L., Théate I., Stroobant V., Colau D., Parmentier N., Boon T., and Van den Eynde B. J. (2003) Evidence for a tumoral immune resistance mechanism based on tryptophan degradation by indoleamine 2,3-dioxygenase. Nat. Med. 9, 1269–1274 - PubMed
    1. Mellor A. L., and Munn D. H. (2004) IDO expression by dendritic cells: tolerance and tryptophan catabolism. Nat. Rev. Immunol. 4, 762–774 - PubMed
    1. Munn D. H., and Mellor A. L. (2007) Indoleamine 2,3-dioxygenase and tumor-induced tolerance. J. Clin. Invest. 117, 1147–1154 - PMC - PubMed

Publication types

MeSH terms

Substances