. 2017 Feb;102(2):282-294.
doi: 10.3324/haematol.2016.147694. Epub 2016 Sep 23.

Germline variants in ETV6 underlie reduced platelet formation, platelet dysfunction and increased levels of circulating CD34+ progenitors

Affiliations

Germline variants in ETV6 underlie reduced platelet formation, platelet dysfunction and increased levels of circulating CD34+ progenitors

Marjorie Poggi et al. Haematologica. 2017 Feb.

Abstract

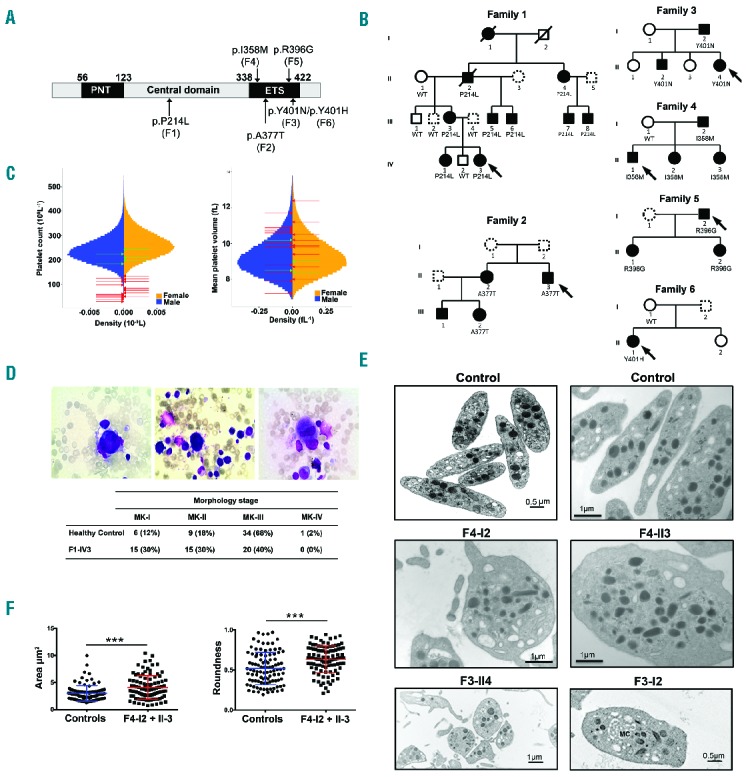
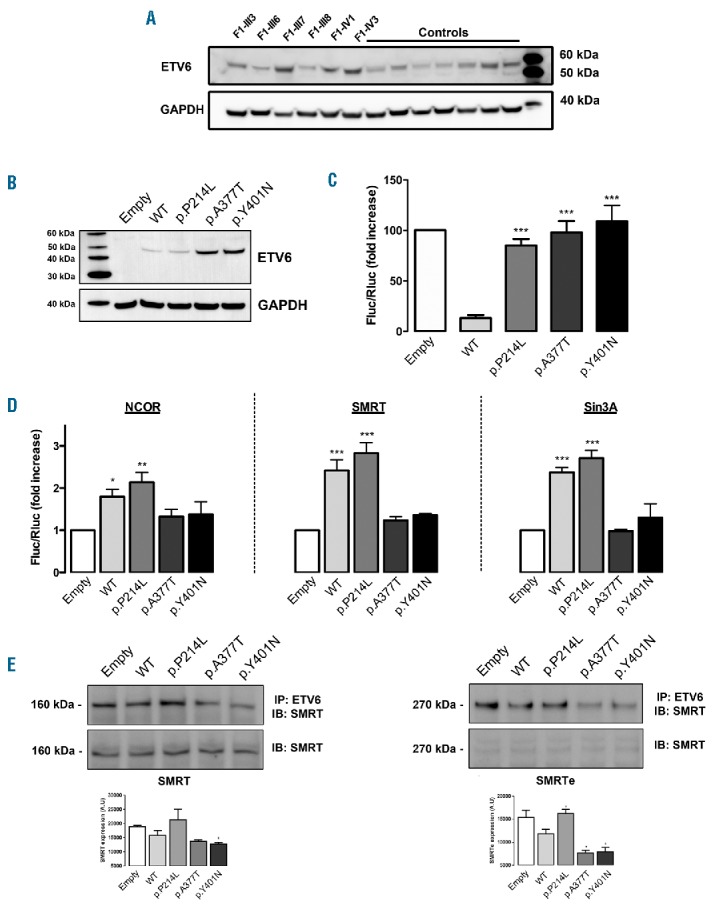
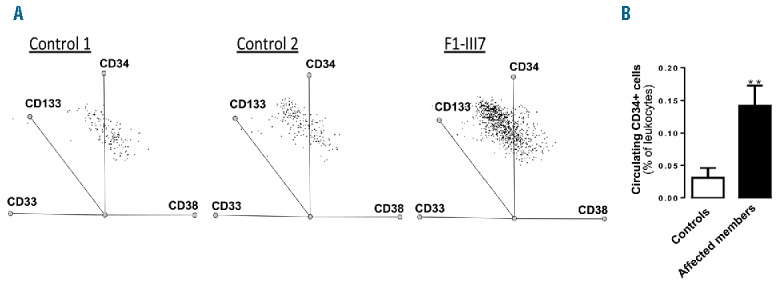
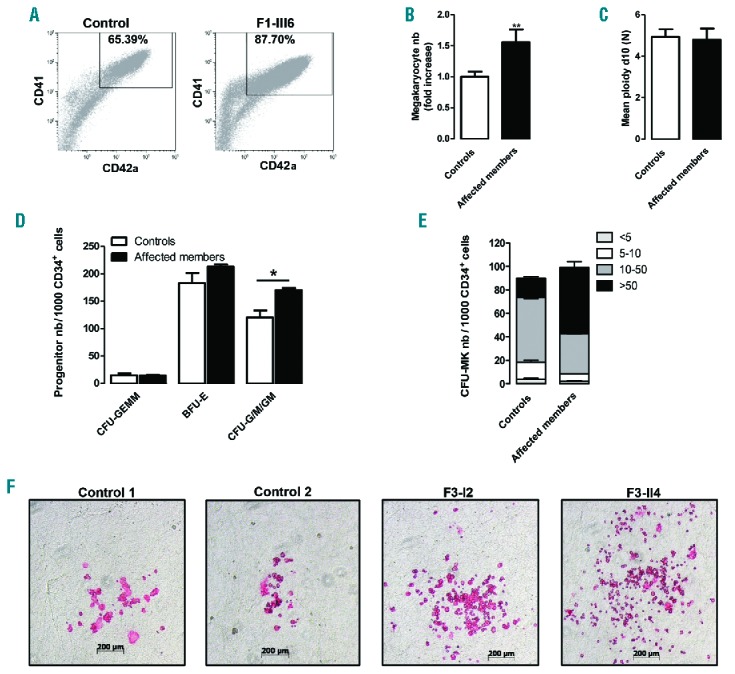
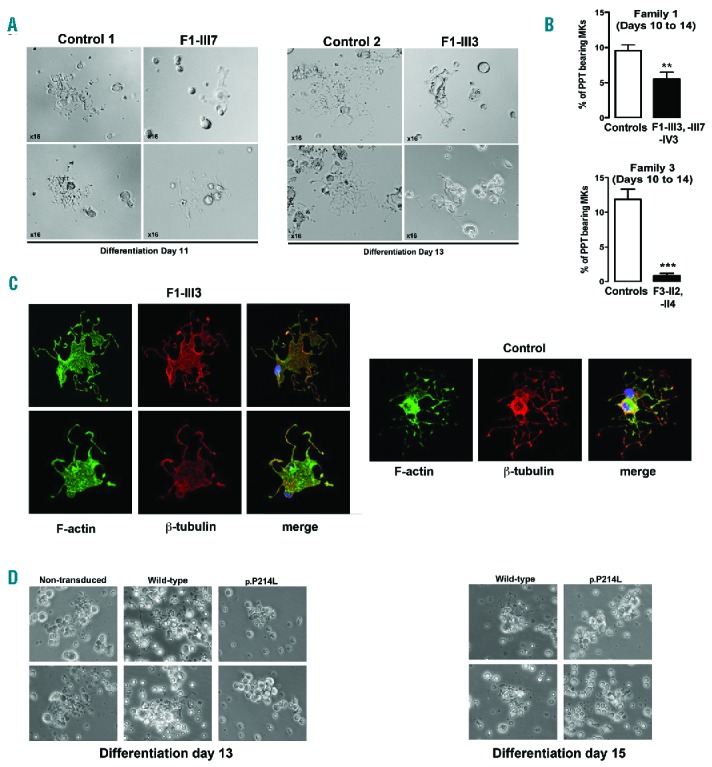
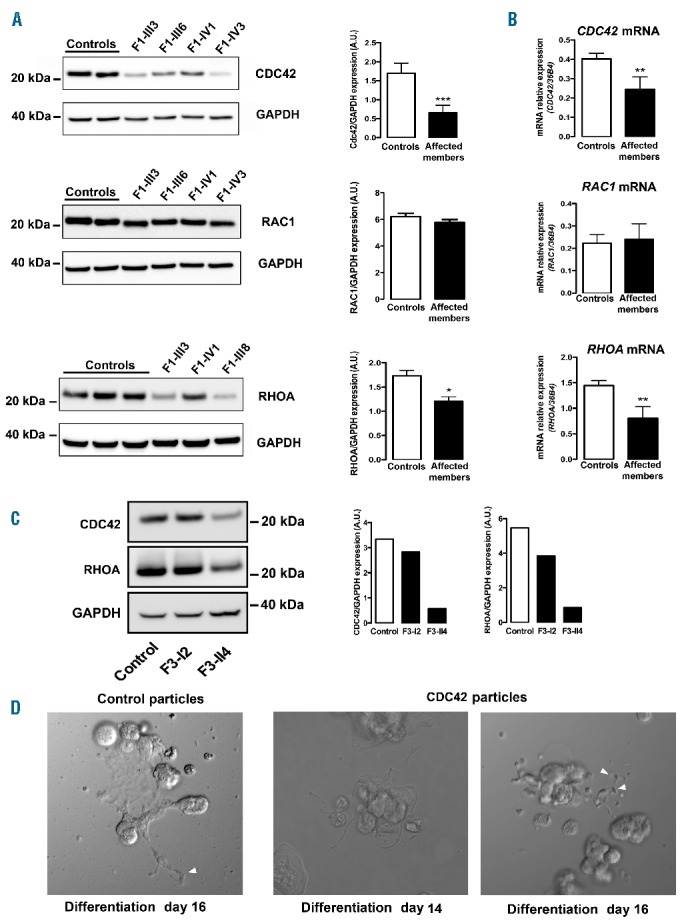
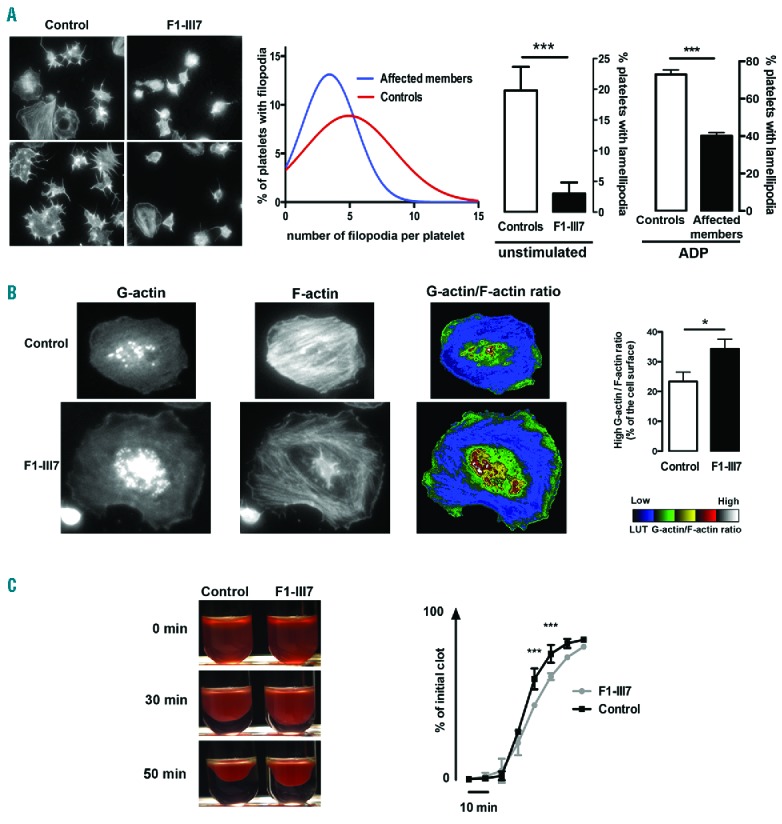
Variants in ETV6, which encodes a transcription repressor of the E26 transformation-specific family, have recently been reported to be responsible for inherited thrombocytopenia and hematologic malignancy. We sequenced the DNA from cases with unexplained dominant thrombocytopenia and identified six likely pathogenic variants in ETV6, of which five are novel. We observed low repressive activity of all tested ETV6 variants, and variants located in the E26 transformation-specific binding domain (encoding p.A377T, p.Y401N) led to reduced binding to corepressors. We also observed a large expansion of megakaryocyte colony-forming units derived from variant carriers and reduced proplatelet formation with abnormal cytoskeletal organization. The defect in proplatelet formation was also observed in control CD34+ cell-derived megakaryocytes transduced with lentiviral particles encoding mutant ETV6. Reduced expression levels of key regulators of the actin cytoskeleton CDC42 and RHOA were measured. Moreover, changes in the actin structures are typically accompanied by a rounder platelet shape with a highly heterogeneous size, decreased platelet arachidonic response, and spreading and retarded clot retraction in ETV6 deficient platelets. Elevated numbers of circulating CD34+ cells were found in p.P214L and p.Y401N carriers, and two patients from different families suffered from refractory anemia with excess blasts, while one patient from a third family was successfully treated for acute myeloid leukemia. Overall, our study provides novel insights into the role of ETV6 as a driver of cytoskeletal regulatory gene expression during platelet production, and the impact of variants resulting in platelets with altered size, shape and function and potentially also in changes in circulating progenitor levels.


Figures

Figure 1.
Figure 1.
Identification of variants in ETV6 underlying AD thrombocytopenia, megakaryocyte and platelet characteristics. (A) Schematic representation of the different domains of the ETV6 protein. The N-terminal domain (PNT), central domain and C-terminal domain containing a DNA-binding domain (ETS) are depicted. Arrows indicate the location of the ETV6 variants and the corresponding family is mentioned in brackets. (B) Pedigrees for the affected families. Squares denote males, circles denote females and slashes represent deceased family members. Black filled symbols represent thrombocytopenic family members and dotted line symbols represent non-tested members. The families F1, F2, F3, F4, F5 and F6 carried the ETV6 p.P214L, p.A377T, p.Y401N, p.I358M, p.R396G and p.Y401H variants, respectively, which segregated with thrombocytopenia. See Table 1 for blood cell count values. (C) Sex-stratified histograms of platelet count and mean platelet volume measurements, obtained using a Coulter hematology analyzer, from 480,001 UK Biobank volunteers, after adjustment for technical artifacts. The red arrows superimposed upon the histograms indicate the sex and values for patients with a deleterious variant in ETV6. The green arrows indicate the sex and values for relatives homozygous for the corresponding wild-type allele. (D) BM smears (May-Grünwald-Giemsa staining) from family F1 propositus (F1-IV3). Left: a relatively immature MK with reduced cytoplasm. Middle: a micromegakaryocyte without granules, with immature cytoplasm (basophilic) and nucleus. Signs of impaired proplatelet formation can be observed. Right: a mature MK of reduced size with a hypolobulated nucleus. Table 1 indicates the % of MKs at each stage of maturation in the BM samples from family F1 proposita (F1-IVI3) and a healthy control. (E) Ultrastructural aspects of platelets from patients F3-I2 and F3-II4, F4-I2 and F4-II3 and unrelated healthy controls. Upper panel: aspect of healthy platelets; middle panel: series of mostly rounder platelets from patients F4-I2 and F4-II3, lower panel: a series of platelets emphasizing anisocytosis in patient F3-114 and a platelet from patient F3-I2 with abnormal membrane complex (MC). Note the heterogeneous presence of α-granules with an occasional granule of increased size. (F) The platelet area and roundness was quantified. Perfect round platelets would have a value of 1. Values are the means and SD as quantified for 50 randomly selected platelets per subject using two-tailed unpaired t-test with Welch’s correction. ***P<0.0001. WT: wild-type; MK: megakaryocyte; PNT: pointed; ETS: ET6 transformation-specific.
Figure 2.
Figure 2.
Effect of the variants on repressive activity and corepressor recruitment. (A) Western blot analysis of ETV6 expression in platelets of 6 affected F1 members and 7 external controls. GAPDH was used as a protein loading control. (B–C) GripTite™ 293 MSR cells were co-transfected with the luciferase reporter plasmid containing 3 tandem copies of the Ets Binding Site (EBS) upstream of HSV-Tk (E743tk80Luc), pCDNA3.1 expression vector (empty, WT or mutETV6) or pGL473 Renilla luciferase control vector. (B) Western blot analysis of ETV6 expression in whole cell lysates of GripTite™ 293 MSR transfected with WT ETV6 or mutETV6 expression vectors. GAPDH was used as a protein loading control. The data are representative of 4 to 8 independent experiments. (C) The firefly to renilla luminescence ratios (Fluc/Rluc) were calculated to compensate for transfection efficiency. The data represent the mean ± SEM of 4 to 8 independent experiments, student’s t-test ***P<0.001 (each condition was compared with WT). (D) Effects of the ETV6 variants on corepressor recruitment. Mammalian two-hybrid analysis of the protein interactions between WT NCOR, SMRT or Sin3A (expressed using the GAL4 DNA-binding domain (DBD) plasmid) and WT ETV6 or mutETV6 (expressed using the GAL4-VP16 activation domain vector). The results are expressed as mean ± SEM of 3 to 8 independent experiments, student’s t-test *P<0.05, **P<0.01, ***P<0.001. (E) Immunoprecipitation of endogenous corepressor SMRT and ETV6 from GripTite™ 293 MSR cells transfected with WT and mutETV6. Immunoprecipitation was performed on cell lysates with ETV6 antibody. The total cell lysates (lower panel) and immunoprecipitates (upper panel) were analyzed via immunoblotting with anti-SMRT antibody. Quantification of band intensity for SMRT and SMRT-extended (SMRTe) is shown below the western blot. The results are expressed as mean ± SEM, student’s t-test, *P<0.05 vs. WT. GAPDH: glyceraldehyde-3-phosphate dehydrogenase; WT: wild-type; A.U: arbitrary unit; IP: immunoprecipitation; IB: immunoblot.
Figure 3.
Figure 3.
Increased numbers of circulating CD34 positive cells in variant carriers. Flow cytometry analysis of CD34+ cells. (A) Representative CD34+/CD38+ dot plot of cells from 2 controls and 1 patient (F1-III7). (B) Histograms show the percentage of CD34+ cells in 8 controls and 5 affected family members (F1-III3, F1-III7, F1-III8, F1-IV1, F1-IV3) (mean ± SEM, student’s t-test, **P<0.01).
Figure 4.
Figure 4.
Megakaryocyte differentiation and colony-forming cell potential. (A–C) In vitro megakaryocyte (MK) differentiation in control or patient peripheral blood CD34+ cells, the cells were analyzed at culture day 10. (A) The data show a representative dot plot of CD41 and CD42a expression in Hoechst+ cells from a control individual and F1-III6. The gate represents mature MKs. (B) The histogram represents the MK (CD41+CD42a+Hoechst+) numbers (nb) in the affected family members (n=9) expressed as fold increase over healthy controls (n=10), student’s t-test, **P<0.01. (C) The ploidy level (N) was analyzed for CD41+CD42a+ MKs, and mean ploidy was calculated using the percentage of cells with 2N, 4N, 8N, 16N and 32N. (D) Methylcellulose assay. The histograms present the number of erythroid (BFU-E), granulo-monocyte (CFU-G/M/GM) and mixed (CFU-GEMM) progenitors from two patients of family F3 with the p.Y401N variant (F3-I2 and F3-II4) and two independent controls. Mean ± SEM, student’s t-test, *P<0.05. (E) Fibrin clot culture. The histograms present the number of MK progenitors (CFU-MK) from two independent controls and two patients (F3-I2 and F3-II4). The CFU-MKs are divided into four categories: <5 MKs per colony, 5–10 MKs per colony, 10–50 MKs per colony or >50 MKs per colony. Error bars represent ± SD of triplicate experiments. (F) Representative pictures of CFU-MKs after CD41 immunostaining. Control 1 and Control 2 represent 2 independent controls, and F3-I2 and F3-II4 are two affected patients. CFU-GEMM: colony-forming unit–granulocyte, erythrocyte, monocyte, megakaryocyte; BFU-E: burst forming unit-erythroid; CFU-G/M/GM: colony-forming unit-granulocytes, macrophages, granulocyte-macrophages; CFU-MK: colony-forming unit-megakaryocyte.
Figure 5.
Figure 5.
ETV6 variants lead to defective proplatelet formation. (A-B) In vitro MK differentiation induced from control or patient peripheral blood CD34+ progenitors in the presence of TPO and SCF. (A) Representative microscopic images of PPT formation in control (n=2) and patient (F1-III7, F1-III3) MKs after 11 or 13 days of culture. (B) The histograms show the percentage of PPT-bearing MKs from members of 2 families (F1-III3, F1-IV3, F1-III7, F3-I2, F3-II4) and 5 independent controls evaluated (3 to 5 evaluations) between culture days 10 to 15. The percentage of PPT-forming MKs was estimated by counting MKs exhibiting ≥1 cytoplasmic processes with areas of constriction. Double-blinded researchers quantified a total of 300–500 cells. The results are expressed as mean ± SEM, student’s t-test **P<0.01 and ***P<0.001. (C) F-actin and β-tubulin staining on PPT-forming MKs from F1-III3 and a control individual, adhering to fibrinogen. Confocal images were acquired at day 12 of culture (x60). (D) In vitro MK differentiation was induced from control peripheral blood CD34+ progenitors transduced with WT or mutETV6 (family F1, c.641C>T, p.P214L) lentiviral particles in the presence of TPO and SCF. Microscopic images of PPT formation were acquired at days 13 and 15 of culture. PPT: proplatelet; MKs: megakaryocytes; F-actin: filamentous actin.
Figure 6.
Figure 6.
Rho GTPase expression analysis. (A) Western blot analysis and quantification of CDC42, RAC1 and RHOA expression in platelet lysates from healthy controls (n=7 for CDC42, n=4 for RAC1, n=4 for RHOA) and affected members from F1 (n=6 for CDC42, n=4 for RAC1 and n=5 for RHOA). GAPDH was used as a protein loading control. The results are expressed as mean ± SEM, student’s t-test *P<0.05 and ***P<0.001. (B) Quantification of CDC42, RAC1 and RHOA mRNA levels in CD34+-derived megakaryocytes (MKs) from healthy controls (n=10) and affected family members from F1 (n=6) and F3 (n=2). mRNA expression levels were measured via reverse transcription polymerase chain reaction (RT-PCR), and expression levels were normalized to housekeeping 36b4 RNA. The results are expressed as mean ± SEM, student’s t-test, **P<0.005. (C) Western blot analysis and quantification of CDC42, RHOA and GAPDH expression in platelets from two affected members of the F3 family (F3-I2 and F3-II4) and a healthy control. (D) In vitro MK differentiation was induced from F1-III7 CD34+ progenitors transduced with control or CDC42 lentiviral particles in the presence of TPO and SCF. Microscopic images of proplatelet (PPT) formation were acquired at days 14 and 16 of culture. The arrows indicate thinner PPT extensions and swellings in the presence of CDC42. Extensions were enlarged in the control. mRNA: messenger RNA; GAPDH: glyceraldehyde-3-phosphate dehydrogenase; A.U: arbitrary unit.
Figure 7.
Figure 7.
Platelet spreading and clot retraction. (A) Left: Representative images of unstimulated platelets spread over immobilized fibronectin. Middle: filopodia formation was quantified according to the number of extensions per unstimulated platelet derived from affected individuals (F1-III3, F1-III7) and healthy controls (n=2). Right: Quantification of lamellipodia-forming cells, at resting and ADP-stimulated conditions, from affected members (F1-III7, F1-III8) and healthy controls (n=2). The data are expressed as mean ± SEM of 5 different view fields. Student’s t-test, ***P<0.001. (B) Actin polymerization quantification in spread unstimulated platelets. Left: representative images of G-actin, F-actin and the G-actin/F-actin ratio in control platelets and the rare spread platelets detected in F1-III7. Platelets were spread over fibronectin and stimulated with ADP. Right: quantification of the area with the high G-actin/F-actin ratio. Quantification of the ratio was performed according to the look-up table as the percentage of the platelet surface (n=20 different cells; mean ± SEM. Student’s t-test *P<0.05). (C) Clot retraction. Left: representative images at 0, 30 and 50 minutes. Right: quantification of the extent of clot retraction expressed as percentage of the initial clot (mean ± SEM, n=2 for F1-III7 and n=4 for controls. Two-way ANOVA, ***P<0.001). F-actin: filamentous actin; G-actin: globular-actin; ADP: adenosine diphosphate; LUT: look-up table.

Similar articles

Cited by

References

    1. Noetzli L, Lo RW, Lee-Sherick AB, et al. Germline mutations in ETV6 are associated with thrombocytopenia, red cell macrocytosis and predisposition to lymphoblastic leukemia. Nat Genet. 2015;47(5):535–538. - PMC - PubMed
    1. Topka S, Vijai J, Walsh MF, et al. Germline ETV6 mutations confer susceptibility to acute lymphoblastic leukemia and thrombocytopenia. PLoS Genet. 2015; 11(6):e1005262. - PMC - PubMed
    1. Zhang MY, Churpek JE, Keel SB, et al. Germline ETV6 mutations in familial thrombocytopenia and hematologic malignancy. Nat Genet. 2015;47(2):180–185. - PMC - PubMed
    1. Rowley JD. The critical role of chromosome translocations in human leukemias. Annu Rev Genet. 1998;32:495–519. - PubMed
    1. Bejar R, Stevenson K, Abdel-Wahab O, et al. Clinical effect of point mutations in myelodysplastic syndromes. N Engl J Med. 2011;364(26):2496–2506. - PMC - PubMed

Publication types

MeSH terms