

B56δ-related protein phosphatase 2A dysfunction identified in patients with intellectual disability
- PMID: 26168268
- PMCID: PMC4623570
- DOI: 10.1172/JCI79860
B56δ-related protein phosphatase 2A dysfunction identified in patients with intellectual disability
Abstract
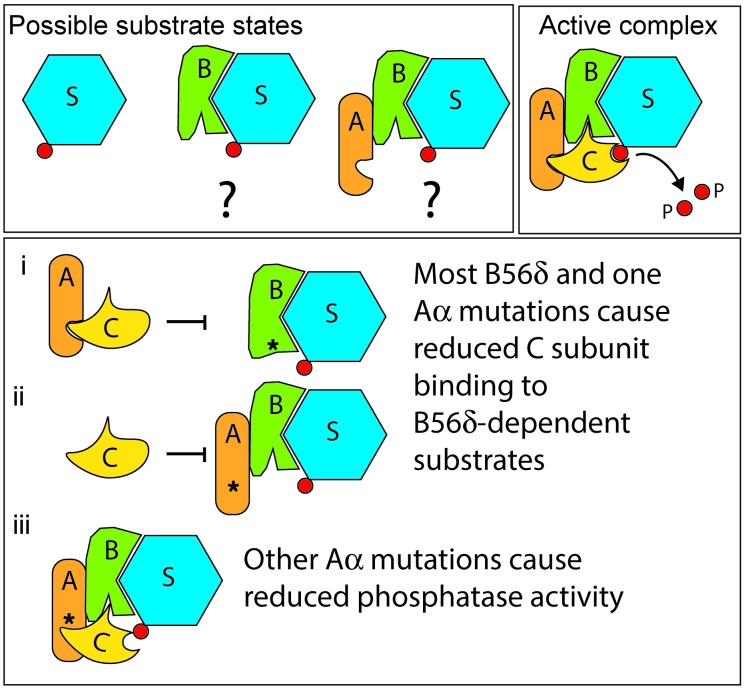
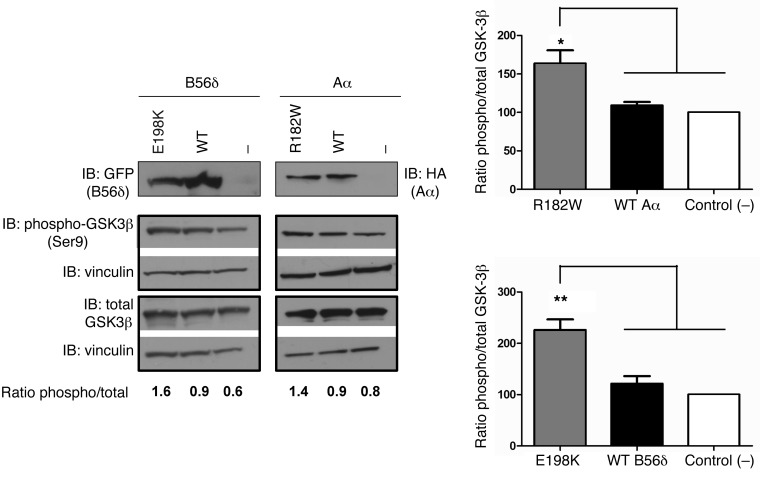
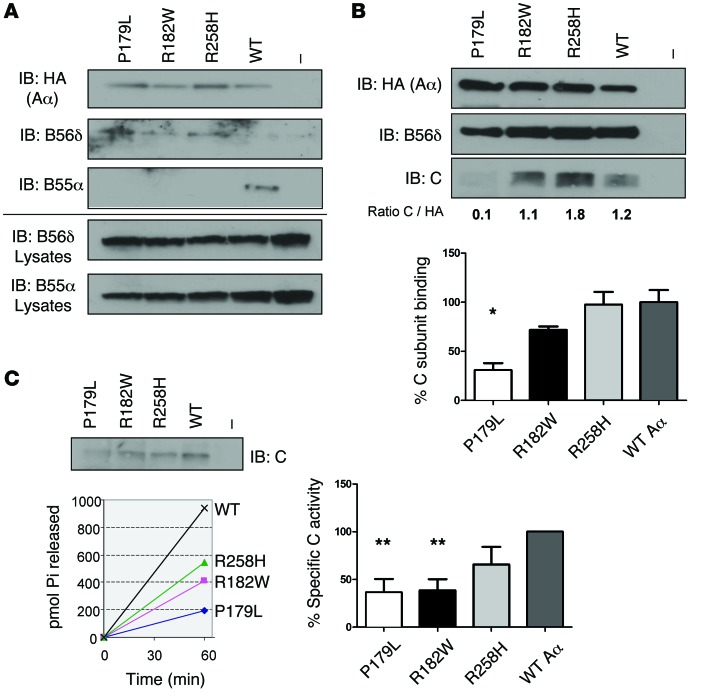
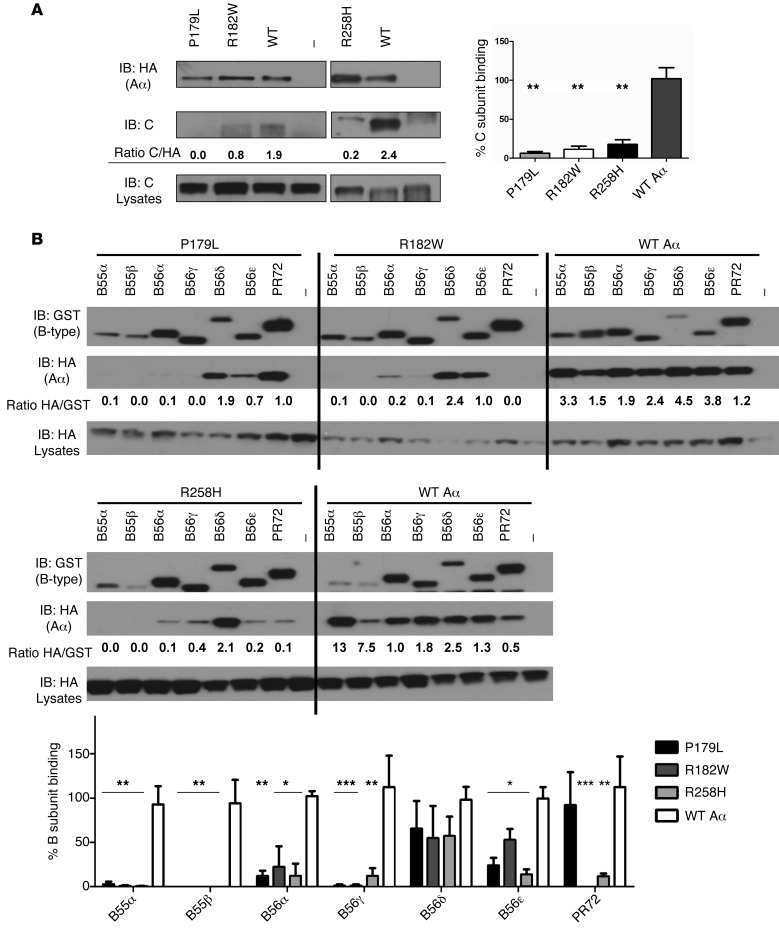
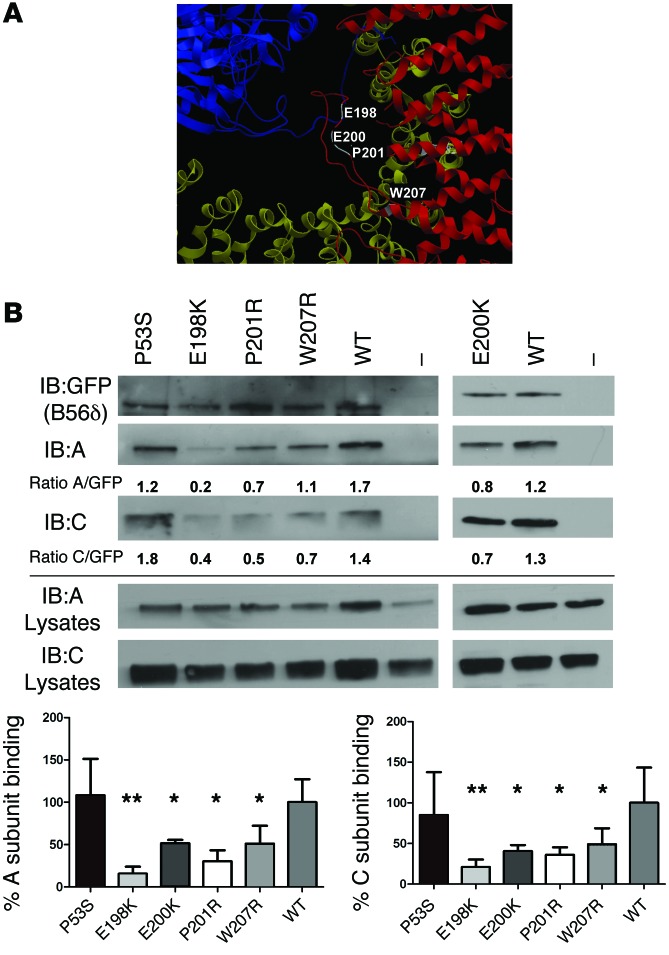
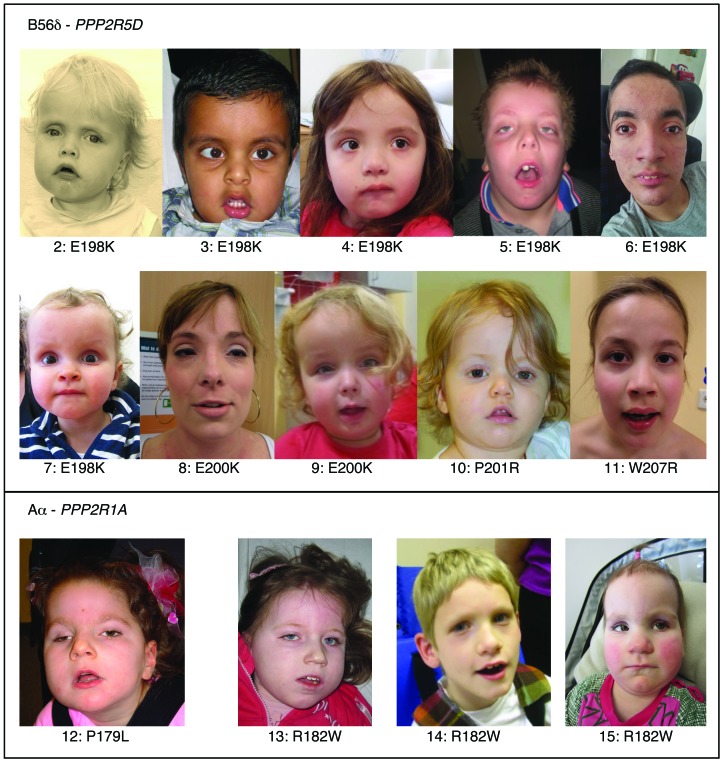
Here we report inherited dysregulation of protein phosphatase activity as a cause of intellectual disability (ID). De novo missense mutations in 2 subunits of serine/threonine (Ser/Thr) protein phosphatase 2A (PP2A) were identified in 16 individuals with mild to severe ID, long-lasting hypotonia, epileptic susceptibility, frontal bossing, mild hypertelorism, and downslanting palpebral fissures. PP2A comprises catalytic (C), scaffolding (A), and regulatory (B) subunits that determine subcellular anchoring, substrate specificity, and physiological function. Ten patients had mutations within a highly conserved acidic loop of the PPP2R5D-encoded B56δ regulatory subunit, with the same E198K mutation present in 6 individuals. Five patients had mutations in the PPP2R1A-encoded scaffolding Aα subunit, with the same R182W mutation in 3 individuals. Some Aα cases presented with large ventricles, causing macrocephaly and hydrocephalus suspicion, and all cases exhibited partial or complete corpus callosum agenesis. Functional evaluation revealed that mutant A and B subunits were stable and uncoupled from phosphatase activity. Mutant B56δ was A and C binding-deficient, while mutant Aα subunits bound B56δ well but were unable to bind C or bound a catalytically impaired C, suggesting a dominant-negative effect where mutant subunits hinder dephosphorylation of B56δ-anchored substrates. Moreover, mutant subunit overexpression resulted in hyperphosphorylation of GSK3β, a B56δ-regulated substrate. This effect was in line with clinical observations, supporting a correlation between the ID degree and biochemical disturbance.
Figures
Similar articles
-
De Novo Mutations Affecting the Catalytic Cα Subunit of PP2A, PPP2CA, Cause Syndromic Intellectual Disability Resembling Other PP2A-Related Neurodevelopmental Disorders.Am J Hum Genet. 2019 Jan 3;104(1):139-156. doi: 10.1016/j.ajhg.2018.12.002. Epub 2018 Dec 27. Am J Hum Genet. 2019. PMID: 30595372 Free PMC article.
-
De novo missense variants in PPP2R5D are associated with intellectual disability, macrocephaly, hypotonia, and autism.Neurogenetics. 2016 Jan;17(1):43-9. doi: 10.1007/s10048-015-0466-9. Epub 2015 Nov 17. Neurogenetics. 2016. PMID: 26576547 Free PMC article.
-
β-Adrenergic regulation of cardiac type 2A protein phosphatase through phosphorylation of regulatory subunit B56δ at S573.J Mol Cell Cardiol. 2018 Feb;115:20-31. doi: 10.1016/j.yjmcc.2017.12.016. Epub 2017 Dec 30. J Mol Cell Cardiol. 2018. PMID: 29294329 Free PMC article.
-
PPP2R5D-Related Intellectual Disability and Neurodevelopmental Delay: A Review of the Current Understanding of the Genetics and Biochemical Basis of the Disorder.Int J Mol Sci. 2020 Feb 14;21(4):1286. doi: 10.3390/ijms21041286. Int J Mol Sci. 2020. PMID: 32074998 Free PMC article. Review.
-
Protein phosphatase 2A - structure, function and role in neurodevelopmental disorders.J Cell Sci. 2021 Jul 1;134(13):jcs248187. doi: 10.1242/jcs.248187. Epub 2021 Jul 6. J Cell Sci. 2021. PMID: 34228795 Free PMC article. Review.
Cited by
-
Validation of a modified version of the gross motor function measure in PPPR5D related neurodevelopmental disorder.Orphanet J Rare Dis. 2024 Feb 7;19(1):45. doi: 10.1186/s13023-024-03067-3. Orphanet J Rare Dis. 2024. PMID: 38326877 Free PMC article.
-
De Novo Mutations Affecting the Catalytic Cα Subunit of PP2A, PPP2CA, Cause Syndromic Intellectual Disability Resembling Other PP2A-Related Neurodevelopmental Disorders.Am J Hum Genet. 2019 Jan 3;104(1):139-156. doi: 10.1016/j.ajhg.2018.12.002. Epub 2018 Dec 27. Am J Hum Genet. 2019. PMID: 30595372 Free PMC article.
-
Protein phosphatases in the regulation of mitosis.J Cell Biol. 2019 Feb 4;218(2):395-409. doi: 10.1083/jcb.201809138. Epub 2018 Nov 16. J Cell Biol. 2019. PMID: 30446607 Free PMC article. Review.
-
Targeting PP2A in cancer: Combination therapies.Biochim Biophys Acta Mol Cell Res. 2019 Jan;1866(1):51-63. doi: 10.1016/j.bbamcr.2018.08.020. Epub 2018 Sep 1. Biochim Biophys Acta Mol Cell Res. 2019. PMID: 30401535 Free PMC article. Review.
-
cAMP regulation of protein phosphatases PP1 and PP2A in brain.Biochim Biophys Acta Mol Cell Res. 2019 Jan;1866(1):64-73. doi: 10.1016/j.bbamcr.2018.09.006. Epub 2018 Sep 18. Biochim Biophys Acta Mol Cell Res. 2019. PMID: 30401536 Free PMC article. Review.
References
Publication types
MeSH terms
Substances
Grants and funding
LinkOut - more resources
Full Text Sources
Other Literature Sources
Medical
Molecular Biology Databases
Miscellaneous
