Adenoassociated virus serotype 9-mediated gene therapy for x-linked adrenoleukodystrophy
- PMID: 25592337
- PMCID: PMC4427888
- DOI: 10.1038/mt.2015.6
Adenoassociated virus serotype 9-mediated gene therapy for x-linked adrenoleukodystrophy
Abstract
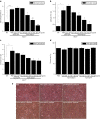
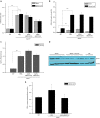
X-linked adrenoleukodystrophy (X-ALD) is a devastating neurological disorder caused by mutations in the ABCD1 gene that encodes a peroxisomal ATP-binding cassette transporter (ABCD1) responsible for transport of CoA-activated very long-chain fatty acids (VLCFA) into the peroxisome for degradation. We used recombinant adenoassociated virus serotype 9 (rAAV9) vector for delivery of the human ABCD1 gene (ABCD1) to mouse central nervous system (CNS). In vitro, efficient delivery of ABCD1 gene was achieved in primary mixed brain glial cells from Abcd1-/- mice as well as X-ALD patient fibroblasts. Importantly, human ABCD1 localized to the peroxisome, and AAV-ABCD1 transduction showed a dose-dependent effect in reducing VLCFA. In vivo, AAV9-ABCD1 was delivered to Abcd1-/- mouse CNS by either stereotactic intracerebroventricular (ICV) or intravenous (IV) injections. Astrocytes, microglia and neurons were the major target cell types following ICV injection, while IV injection also delivered to microvascular endothelial cells and oligodendrocytes. IV injection also yielded high transduction of the adrenal gland. Importantly, IV injection of AAV9-ABCD1 reduced VLCFA in mouse brain and spinal cord. We conclude that AAV9-mediated ABCD1 gene transfer is able to reach target cells in the nervous system and adrenal gland as well as reduce VLCFA in culture and a mouse model of X-ALD.
Figures


Similar articles
-
Intrathecal Adeno-Associated Viral Vector-Mediated Gene Delivery for Adrenomyeloneuropathy.Hum Gene Ther. 2019 May;30(5):544-555. doi: 10.1089/hum.2018.079. Epub 2018 Dec 18. Hum Gene Ther. 2019. PMID: 30358470 Free PMC article.
-
Impaired very long-chain acyl-CoA β-oxidation in human X-linked adrenoleukodystrophy fibroblasts is a direct consequence of ABCD1 transporter dysfunction.J Biol Chem. 2013 Jun 28;288(26):19269-79. doi: 10.1074/jbc.M112.445445. Epub 2013 May 13. J Biol Chem. 2013. PMID: 23671276 Free PMC article.
-
Astrocytes and mitochondria from adrenoleukodystrophy protein (ABCD1)-deficient mice reveal that the adrenoleukodystrophy-associated very long-chain fatty acids target several cellular energy-dependent functions.Biochim Biophys Acta. 2015 May;1852(5):925-36. doi: 10.1016/j.bbadis.2015.01.005. Epub 2015 Jan 10. Biochim Biophys Acta. 2015. PMID: 25583114
-
[Adrenoleukodystrophy: molecular pathogenesis and development of therapeutic agents].Yakugaku Zasshi. 2007 Jul;127(7):1059-64. doi: 10.1248/yakushi.127.1059. Yakugaku Zasshi. 2007. PMID: 17603264 Review. Japanese.
-
Biochemical aspects of X-linked adrenoleukodystrophy.Brain Pathol. 2010 Jul;20(4):831-7. doi: 10.1111/j.1750-3639.2010.00391.x. Brain Pathol. 2010. PMID: 20626744 Free PMC article. Review.
Cited by
-
Role of Basal Forebrain Neurons in Adrenomyeloneuropathy in Mice and Humans.Ann Neurol. 2024 Mar;95(3):442-458. doi: 10.1002/ana.26849. Epub 2023 Dec 26. Ann Neurol. 2024. PMID: 38062617 Free PMC article.
-
Current and Future Prospects for Gene Therapy for Rare Genetic Diseases Affecting the Brain and Spinal Cord.Front Mol Neurosci. 2021 Oct 6;14:695937. doi: 10.3389/fnmol.2021.695937. eCollection 2021. Front Mol Neurosci. 2021. PMID: 34690692 Free PMC article. Review.
-
Practical Approach to Longitudinal Neurologic Care of Adults With X-Linked Adrenoleukodystrophy and Adrenomyeloneuropathy.Neurol Genet. 2024 Oct 3;10(5):e200192. doi: 10.1212/NXG.0000000000200192. eCollection 2024 Oct. Neurol Genet. 2024. PMID: 39372123 Free PMC article. Review.
-
In vivo gene editing via homology-independent targeted integration for adrenoleukodystrophy treatment.Mol Ther. 2022 Jan 5;30(1):119-129. doi: 10.1016/j.ymthe.2021.05.022. Epub 2021 May 29. Mol Ther. 2022. PMID: 34058389 Free PMC article.
-
Delivering AAV to the Central Nervous and Sensory Systems.Trends Pharmacol Sci. 2021 Jun;42(6):461-474. doi: 10.1016/j.tips.2021.03.004. Epub 2021 Apr 13. Trends Pharmacol Sci. 2021. PMID: 33863599 Free PMC article. Review.
References
-
- Mosser J, Douar AM, Sarde CO, Kioschis P, Feil R, Moser H, et al. Putative X-linked adrenoleukodystrophy gene shares unexpected homology with ABC transporters. Nature. 1993;361:726–730. - PubMed
-
- Moser AB, Kreiter N, Bezman L, Lu S, Raymond GV, Naidu S, et al. Plasma very long chain fatty acids in 3,000 peroxisome disease patients and 29,000 controls. Ann Neurol. 1999;45:100–110. - PubMed
-
- Valianpour F, Selhorst JJ, van Lint LE, van Gennip AH, Wanders RJ, Kemp S. Analysis of very long-chain fatty acids using electrospray ionization mass spectrometry. Mol Genet Metab. 2003;79:189–196. - PubMed
Publication types
MeSH terms
Substances
Grants and funding
LinkOut - more resources
Full Text Sources
Other Literature Sources
Medical

