. 2015 Jan 22;57(2):361-75.
doi: 10.1016/j.molcel.2014.12.006. Epub 2015 Jan 8.

Locus-specific targeting to the X chromosome revealed by the RNA interactome of CTCF

Affiliations

Locus-specific targeting to the X chromosome revealed by the RNA interactome of CTCF

Johnny T Kung et al. Mol Cell. .

Abstract

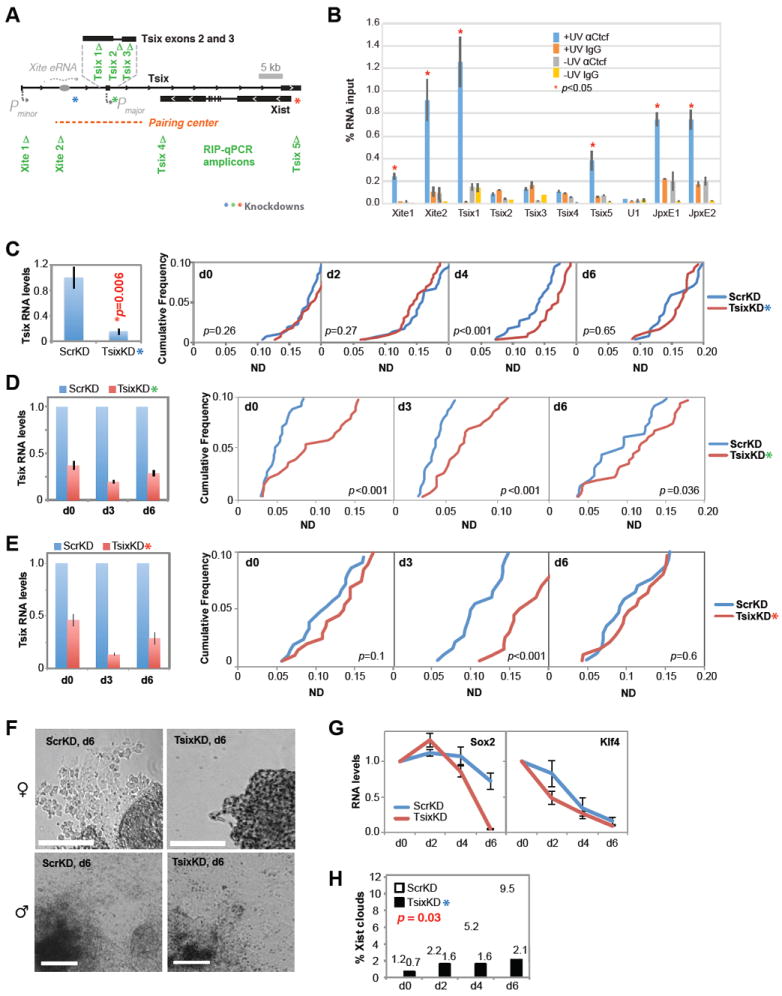
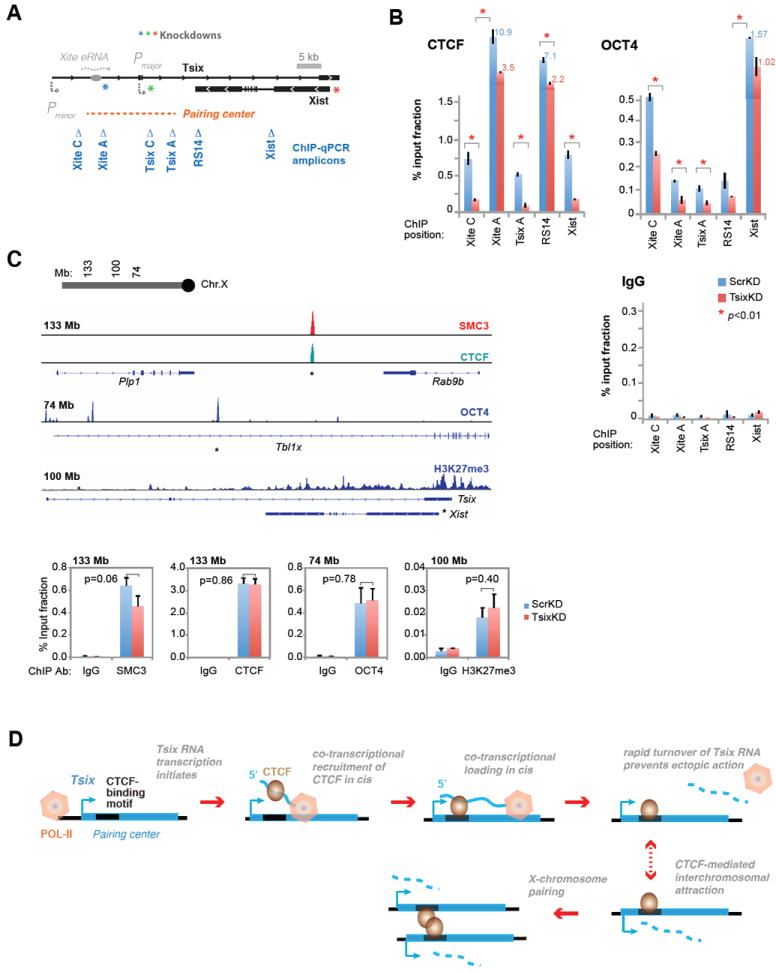
CTCF is a master regulator that plays important roles in genome architecture and gene expression. How CTCF is recruited in a locus-specific manner is not fully understood. Evidence from epigenetic processes, such as X chromosome inactivation (XCI), indicates that CTCF associates functionally with RNA. Using genome-wide approaches to investigate the relationship between its RNA interactome and epigenomic landscape, here we report that CTCF binds thousands of transcripts in mouse embryonic stem cells, many in close proximity to CTCF's genomic binding sites. CTCF is a specific and high-affinity RNA-binding protein (Kd < 1 nM). During XCI, CTCF differentially binds the active and inactive X chromosomes and interacts directly with Tsix, Xite, and Xist RNAs. Tsix and Xite RNAs target CTCF to the X inactivation center, thereby inducing homologous X chromosome pairing. Our work elucidates one mechanism by which CTCF is recruited in a locus-specific manner and implicates CTCF-RNA interactions in long-range chromosomal interactions.


Figures

Figure 1
Figure 1. The CTCF-RNA interactome
See also Tables S1-S2 and Figures S1-S4. (A) Percentage of total, sense, and antisense CTCF CLIP peaks from d0 mESC in indicated genomic regions. (B) Average d0 CLIP peaks profile over a 3-kb metagene (RefSeq genes) ±1 kb flanking region. (C) Average profile of d0 CLIP peaks within ±4 kb of TSS and TTS. (D) Scatterplot comparing CLIP-seq and input RNA-seq coverages. d3 data shown. Input RNAs were assembled from RNA-seq data. For CLIP-seq, coverage under all peaks within each transcript was summed for division over the transcript length. Red diagonal, x=y. Pearson’s correlation r = 0.287, p = 2.94×10-178. (E) Metagene profiles comparing d3 CTCF CLIP (red) and ChIP (blue) peaks. (F) Average profile of d3 ChIP peaks relative to CLIP peaks. CLIP-seq peak is centered at nt 0 on the x-axis.
Figure 2
Figure 2. The RNA interactome and epigenomic landscape of CTCF
See also Tables S1-S2 and Figures S4 and S6. Normalized CTCF CLIP-seq, ChIP-seq, and RNA-seq signals for (A) Sox2, (B) Sra1, (C) Jpx, (D) Xite and 5’ end of Tsix, and (E) 5’ end of Xist. Below each CLIP and ChIP tracks are corresponding statistically significant “peaks”. Red dashed lines denote repeat motifs within Xist/Tsix. P1 and P2, two Xist promoters. +, Watson strand; -, Crick strand.
Figure 3
Figure 3. Allele-specific binding of CTCF on the X-chromosome
See also Figure S4-S5. Day 3 CTCF ChIP peaks, CLIP peaks, and RNA-seq signals over (A) the X chromosome, (B) Kdm6a, and (C) Mid1. Only statistically significant ChIP and CLIP peaks are shown. Composite (comp) = sum of all peaks (cas, mus, and neutral). cas = Xa; mus = Xi. Day 3 ES composite Xist CHART, day 7 ES allelic H3K27me3 ChIP (Simon et al., 2013), and mouse embryonic fibroblast allelic H3K4me3 ChIP (Yildirim et al., 2012) data also included for comparison. (D) qRT-PCR for in vitro RNA pulldown with FLAG-CTCF, FLAG-GFP, and mock. Representative results from four biological replicates shown. Means ±1 SD. *, p<0.05, as determined by unpaired two-tailed Student’s t-test comparing each amplicon to Ppia. (E) UV-RIP qRT-PCR, comparing αCTCF and IgG immunoprecipitation day 3 female mESC ± UV crosslinking. Means ±1 SD shown. Representative results from three biological replicates shown. *, significant enrichment (p<0.05, determined by unpaired two-tailed Student’s t-test) of +UV αCTCF pulldown over +UV IgG pulldown; †, significant enrichment of +UV αCTCF pulldown over –UV αCTCF pulldown.
Figure 4
Figure 4. CTCF binds RNA specifically with very high affinity
See also Figure S5-S6. (A) RNA EMSA using 1.5 pmol of purified recombinant FLAG-CTCF or FLAG-GFP and 0.5 pmol of various in vitro-transcribed, end-labelled RNA probes. Comp, unlabelled competitors at 40× molar excess. *, CTCF-RNA shift. (B) RNA EMSA using 1.5 pmol of CTCF or GFP and 0.5 pmol of Tsix RNA fragments. Map of Xite/Tsix and EMSA probes shown. Comp, unlabelled competitors at 40× molar excess. *, CTCF-RNA shift. (C) RNA EMSA with 0.5 pmol of purified Tsix probe d and 1.5 pmol of full-length CTCF (FL), or GST-CTCF fragments: N, N-terminal domain; Zn, zinc-finger domain; C, C-terminal domain; or GST alone. Comp, unlabelled competitors at 40× molar excess. (D) Double-filter binding assays were used to plot binding isotherms of CTCF at 0.2 nM RNA of indicated species. Serial 2.5-fold dilution from 0-30 nM active CTCF. CTCF concentrations corrected using the active fraction calculation (Fig. S5B). Bound, nitrocellulose membrane. Free, nylon membrane. (E) Left panel: Binding isotherms for CTCF-RNA interactions. Right panel: Kd and R2 values for CTCF binding to RNA species. “≫30 nM” denotes a Kd above measurable range. (F) Kd values do not correlate with RNA size (p=0.7834).
Figure 5
Figure 5. CTCF prefers RNA over DNA
See also Figure S5. (A) DNA EMSAs using 0.2 nM probe of the indicated species, titrated against 2-fold serial dilutions of active CTCF protein up to 300 nM. *, CTCF-DNA shift. (B) Kd and R2 values for CTCF binding to various DNA species. “≫300 nM” denotes a Kd above measurable range. (C) Map of competition EMSA probes. RNA probe corresponds to a CLIP-seq fragment of Tsix RNA as shown. DNA probes are derived from ChIP-seq peaks within Xite and Tsix, as shown. (D) Competition EMSA using 0.2 nM Tsix RNA CLIP probe and 5 nM purified CTCF, in the presence of 0, 0.2, 2.0, 20, and 200 nM of cold DNA competitor (comp) indicated. *, CTCF-Tsix RNA shift. “Tsix CLIP DNA” refers to DNA probe bearing the sequence of the Tsix CLIP-seq fragment, serving as negative control. (E,F) Reciprocal competition EMSA using 0.2 nM ChIP1 (E) or ChIP2 (F) DNA probe and 200 nM purified CTCF, in the presence of 0, 0.2, 2.0, 20, and 200 nM of the cold RNA competitor (comp) indicated. *, CTCF-DNA shift. ChIP1 and ChIP2 RNA refer to RNA probe bearing the sequence of ChIP1 and ChIP2, serving as negative control.
Figure 6
Figure 6. Tsix and Xite RNAs are required for X-X pairing
See also Figure S7. (A) Map of Xic and pairing center, with positions for RIP-qPCR primers and EMSA probes (arrowheads). TsixKD positions (asterisks): blue, shRNA; green, LNA; red, LNA. The Tsix major promoter accounts for 90% of Tsix transcripts. Position of the TsixTST truncation allele is shown. Xite enhancer expresses an eRNA. (B) RIP qRT-PCR, ±UV, on d3 female mESC at various domains with Tsix and Xite, with Jpx as positive control and U1 snRNA as negative control. qPCR positions shown in panel A. Means ±1 SD shown from two biological replicates. All values normalized to 1% of input RNA. p, determined by unpaired two-tailed Student t-tests comparing CTCF to IgG pulldowns in the +UV samples. (C) Effect of TsixKD on pairing in female clones stably expressing shTsix versus shScr. DNA FISH using a two-probe combination of RP24 (centromeric) and pSx9 (Xist/Tsix) was performed. To exclude XO artifacts, only nuclei with two RP24 signals were scored. Cumulative frequency curves shown for decile with closest X-X distances. Whole distributions shown in Fig. S7. The significance of the difference, p, in pairwise comparisons between ScrKD and TsixKD on various differentiation days is determined using unpaired two-tailed Student t-tests. Representative results shown for two independent biological replicates. Sample sizes, n: ScrKD: 261 (d0), 297 (d2), 295 (d4), 254 (d6); TsixKD: 263 (d0), 332 (d2), 282 (d4), 246 (d6). (D,E) Quantitation of Tsix RNA after ScrKD versus TsixKD using two LNAs. Pairing analysis performed as in panel C. Whole distributions shown in Fig. S7. Representative results shown from 2-3 independent biological replicates. D, sample sizes: ScrKD: 295 (d0), 289 (d3), 294 (d6); TsixKD: 277 (d0), 303 (d3), 310 (d6). E, sample sizes: ScrKD: 212 (d0), 186 (d3), 171 (d6); TsixKD, 205 (d0), 202 (d3), 186 (d6). (F) EB outgrowth of shTsix KD mESC was severely compromised. Scale bar, 100 μm. (G) Pluripotency markers are appropriately downregulated in female shTsix KD cells, suggesting proper cell differentiation. Means ± 1 SD shown. (H) Xist RNA FISH in shRNA TsixKD versus ScrKD during differentiation. p, determined by χ2 test comparing the distribution of Xist+ cells for ScrKD versus TsixKD from d0, d2, d4, and d6; [(observed-expected)2/expected], degrees of freedom=3.
Figure 7
Figure 7. Tsix and Xite RNAs target CTCF in cis to the pairing center
(A) Map of Xic and pairing center, with positions for ChIP primers. TsixKD positions, asterisks (B) ChIP-qPCR in stable shTsix or shScr KD clones. Means ±1 SD shown from four biological replicates. p determined by unpaired two-tailed t-tests. (C) Control ChIP experiments. Top panels: ChIP-seq analysis of CTCF and various control epitopes (OCT4, SMC3, and H3K27me3) at other positions along the X chromosome. Bottom panels: ChIP-qPCR in shScr and shTsix at indicated sites of X chromosome shows that CTCF binding is not significantly affected by the Tsix/Xite knockdown. Means ±1 S.D. shown for three independent biological replicates. (D) Site-specific action of Tsix RNA facilitates locus-specific targeting of CTCF. POL-II transcribes Tsix RNA, which remains tethered to the site of synthesis as the RNA binds CTCF. A rapid turnover of Tsix RNA (t1/2, 30-60 min) enables its site-specific action. Targeting of CTCF in turn mediates X-X pairing.

Similar articles

Cited by

References

    1. Ahn JY, Lee JT. Retinoic acid accelerates downregulation of the Xist repressor, Oct4, and increases the likelihood of Xist activation when Tsix is deficient. BMC Dev Biol. 2010;10:90. - PMC - PubMed
    1. Bacher CP, Guggiari M, Brors B, Augui S, Clerc P, Avner P, Eils R, Heard E. Transient colocalization of X-inactivation centres accompanies the initiation of X inactivation. Nat Cell Biol. 2006;8:293–299. - PubMed
    1. Barlow DP, Bartolomei MS. Genomic imprinting in mammals. Cold Spring Harb Perspect Biol. 2014;6 - PMC - PubMed
    1. Bell AC, Felsenfeld G. Methylation of a CTCF-dependent boundary controls imprinted expression of the Igf2 gene. Nature. 2000;405:482–485. - PubMed
    1. Calabrese JM, Sun W, Song L, Mugford JW, Williams L, Yee D, Starmer J, Mieczkowski P, Crawford GE, Magnuson T. Site-specific silencing of regulatory elements as a mechanism of X inactivation. Cell. 2012;151:951–963. - PMC - PubMed

Publication types