

Visualization and analytics tools for infectious disease epidemiology: a systematic review
- PMID: 24747356
- PMCID: PMC5734643
- DOI: 10.1016/j.jbi.2014.04.006
Visualization and analytics tools for infectious disease epidemiology: a systematic review
Abstract
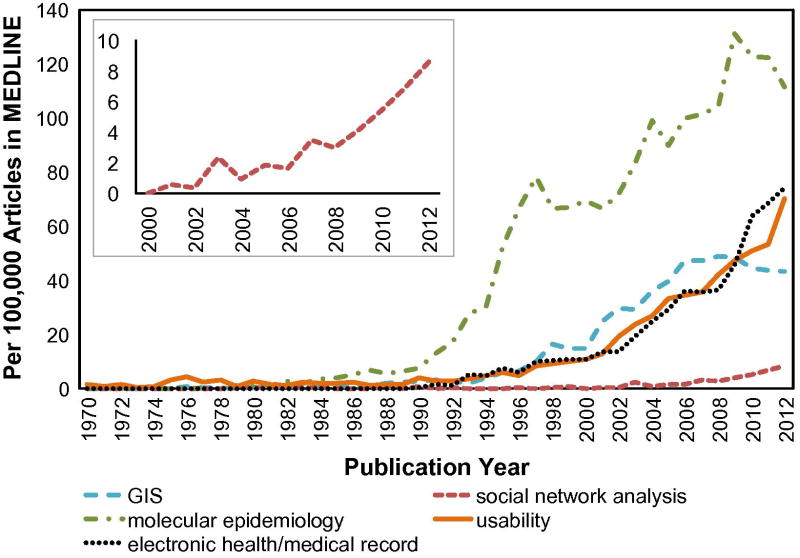
Background: A myriad of new tools and algorithms have been developed to help public health professionals analyze and visualize the complex data used in infectious disease control. To better understand approaches to meet these users' information needs, we conducted a systematic literature review focused on the landscape of infectious disease visualization tools for public health professionals, with a special emphasis on geographic information systems (GIS), molecular epidemiology, and social network analysis. The objectives of this review are to: (1) identify public health user needs and preferences for infectious disease information visualization tools; (2) identify existing infectious disease information visualization tools and characterize their architecture and features; (3) identify commonalities among approaches applied to different data types; and (4) describe tool usability evaluation efforts and barriers to the adoption of such tools.
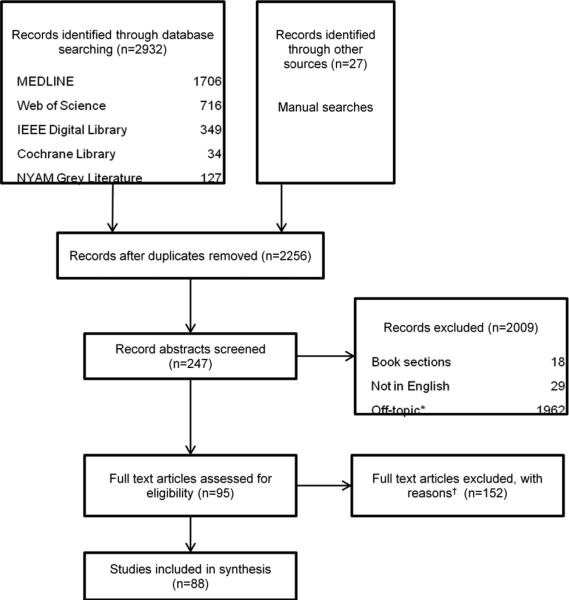
Methods: We identified articles published in English from January 1, 1980 to June 30, 2013 from five bibliographic databases. Articles with a primary focus on infectious disease visualization tools, needs of public health users, or usability of information visualizations were included in the review.
Results: A total of 88 articles met our inclusion criteria. Users were found to have diverse needs, preferences and uses for infectious disease visualization tools, and the existing tools are correspondingly diverse. The architecture of the tools was inconsistently described, and few tools in the review discussed the incorporation of usability studies or plans for dissemination. Many studies identified concerns regarding data sharing, confidentiality and quality. Existing tools offer a range of features and functions that allow users to explore, analyze, and visualize their data, but the tools are often for siloed applications. Commonly cited barriers to widespread adoption included lack of organizational support, access issues, and misconceptions about tool use.
Discussion and conclusion: As the volume and complexity of infectious disease data increases, public health professionals must synthesize highly disparate data to facilitate communication with the public and inform decisions regarding measures to protect the public's health. Our review identified several themes: consideration of users' needs, preferences, and computer literacy; integration of tools into routine workflow; complications associated with understanding and use of visualizations; and the role of user trust and organizational support in the adoption of these tools. Interoperability also emerged as a prominent theme, highlighting challenges associated with the increasingly collaborative and interdisciplinary nature of infectious disease control and prevention. Future work should address methods for representing uncertainty and missing data to avoid misleading users as well as strategies to minimize cognitive overload.
Keywords: Disease surveillance; GIS; Infectious disease; Public health; Social network analysis; Visualization.
Copyright © 2014 The Authors. Published by Elsevier Inc. All rights reserved.
Figures
Similar articles
-
Online GIS services for mapping and sharing disease information.Int J Health Geogr. 2008 Feb 25;7:8. doi: 10.1186/1476-072X-7-8. Int J Health Geogr. 2008. PMID: 18298859 Free PMC article.
-
The future of Cochrane Neonatal.Early Hum Dev. 2020 Nov;150:105191. doi: 10.1016/j.earlhumdev.2020.105191. Epub 2020 Sep 12. Early Hum Dev. 2020. PMID: 33036834
-
Folic acid supplementation and malaria susceptibility and severity among people taking antifolate antimalarial drugs in endemic areas.Cochrane Database Syst Rev. 2022 Feb 1;2(2022):CD014217. doi: 10.1002/14651858.CD014217. Cochrane Database Syst Rev. 2022. PMID: 36321557 Free PMC article.
-
Spatial methods for infectious disease outbreak investigations: systematic literature review.Euro Surveill. 2015;20(39). doi: 10.2807/1560-7917.ES.2015.20.39.30026. Euro Surveill. 2015. PMID: 26536896 Review.
-
Surveillance in eradication and elimination of infectious diseases: a progression through the years.Vaccine. 2011 Dec 30;29 Suppl 4:D141-4. doi: 10.1016/j.vaccine.2011.12.135. Vaccine. 2011. PMID: 22486975 Review.
Cited by
-
Making data map-worthy-enhancing routine malaria data to support surveillance and mapping of Plasmodium falciparum anti-malarial resistance in a pre-elimination sub-Saharan African setting: a molecular and spatiotemporal epidemiology study.Malar J. 2022 Jun 29;21(1):207. doi: 10.1186/s12936-022-04224-4. Malar J. 2022. PMID: 35768869 Free PMC article.
-
An international comparison of noncommunicable disease reporting: the case of diabetes mellitus.J Health Monit. 2019 Jun 27;4(2):64-85. doi: 10.25646/5989. eCollection 2019 Jun. J Health Monit. 2019. PMID: 35146248 Free PMC article.
-
Development of a usability checklist for public health dashboards to identify violations of usability principles.J Am Med Inform Assoc. 2022 Oct 7;29(11):1847-1858. doi: 10.1093/jamia/ocac140. J Am Med Inform Assoc. 2022. PMID: 35976140 Free PMC article.
-
Developing a Data Dashboard Framework for Population Health Surveillance: Widening Access to Clinical Trial Findings.JMIR Form Res. 2019 Apr 4;3(2):e11342. doi: 10.2196/11342. JMIR Form Res. 2019. PMID: 30946016 Free PMC article.
-
Evidence in Practice - A Pilot Study Leveraging Companion Animal and Equine Health Data from Primary Care Veterinary Clinics in New Zealand.Front Vet Sci. 2016 Dec 23;3:116. doi: 10.3389/fvets.2016.00116. eCollection 2016. Front Vet Sci. 2016. PMID: 28066777 Free PMC article.
References
-
- Bos L, Blobel B. Semantic interoperability between clinical and public health information systems for improving public health services. Medical and Care Compunetics Four. 2007;4:256. - PubMed
-
- Friede A, Blum HL, McDonald M. Public health informatics: how information-age technology can strengthen public health. Annual Review of Public Health. 1995;16(1):239–252. - PubMed
-
- Baker EL, et al. CDC's Information Network for Public Health Officials (INPHO): a framework for integrated public health information and practice. Journal of Public Health Management and Practice. 1995;1(1):43–47. - PubMed
-
- Victor LY, Edberg SC. Global Infectious Diseases and Epidemiology Network (GIDEON): a world wide Web-based program for diagnosis and informatics in infectious diseases. Clinical infectious diseases. 2005;40(1):123–126. - PubMed
Publication types
MeSH terms
Grants and funding
LinkOut - more resources
Full Text Sources
Other Literature Sources
Medical
Research Materials
Miscellaneous
