. 2013 Dec 12;39(6):1143-57.
doi: 10.1016/j.immuni.2013.10.018. Epub 2013 Dec 5.

Intracellular complement activation sustains T cell homeostasis and mediates effector differentiation

Affiliations

Intracellular complement activation sustains T cell homeostasis and mediates effector differentiation

M Kathryn Liszewski et al. Immunity. .

Abstract

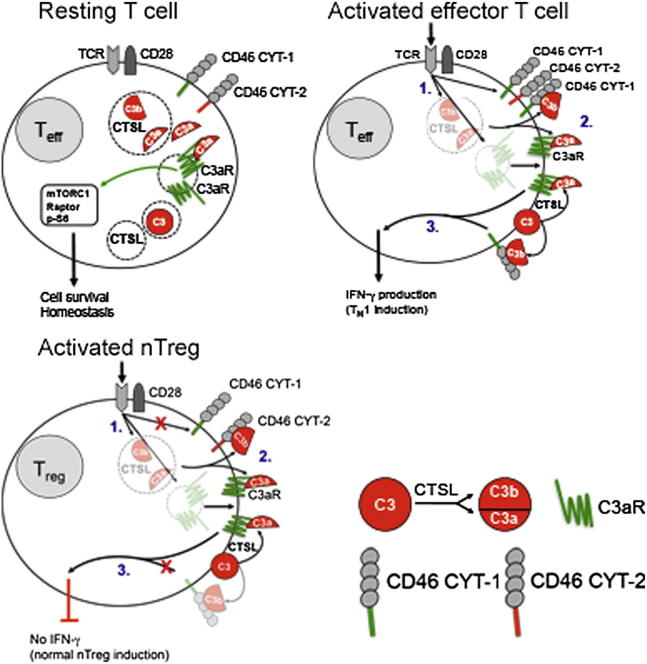
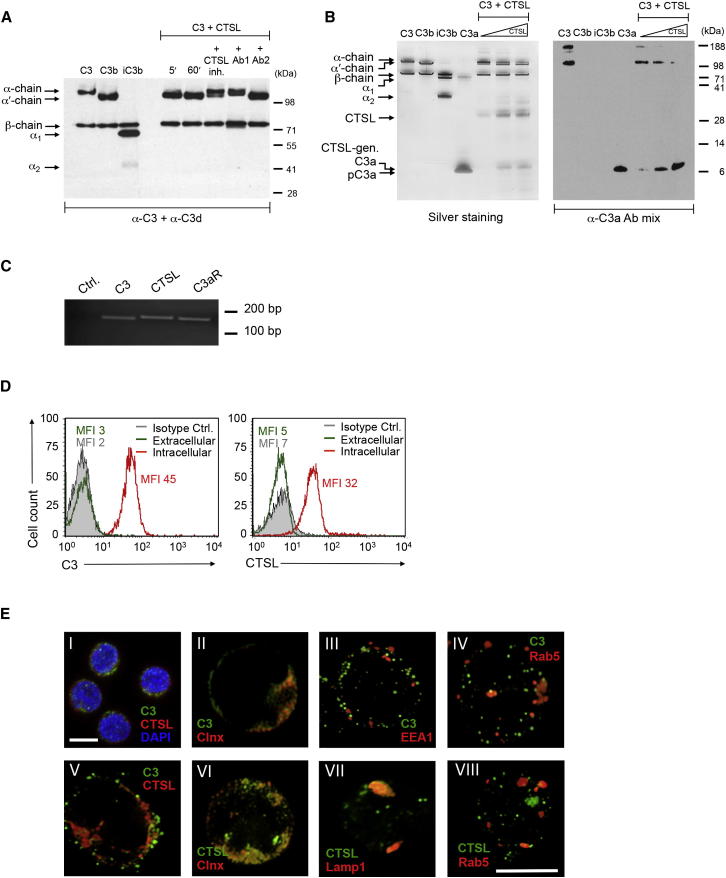
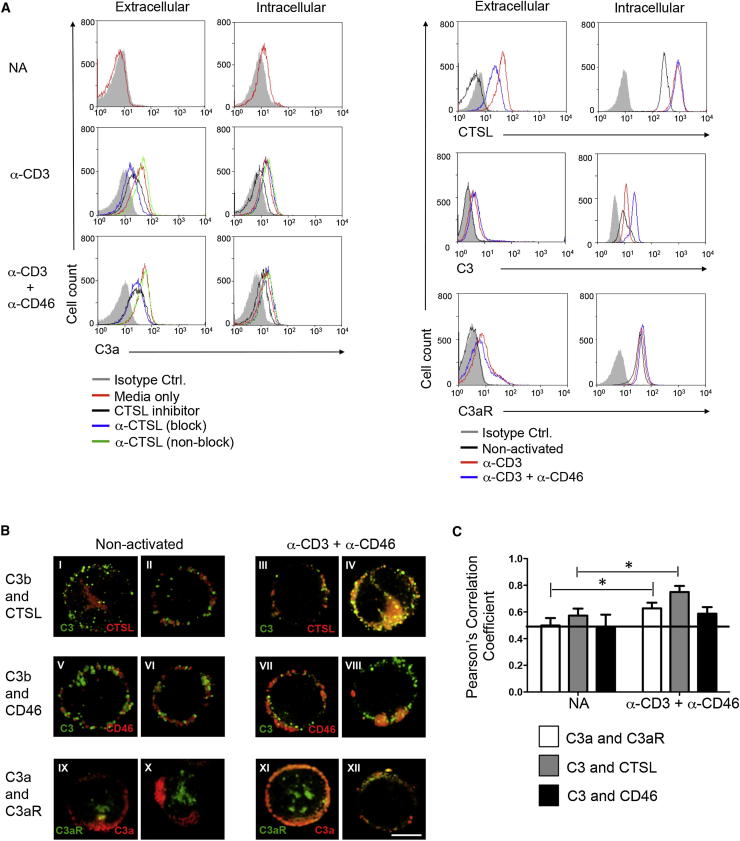
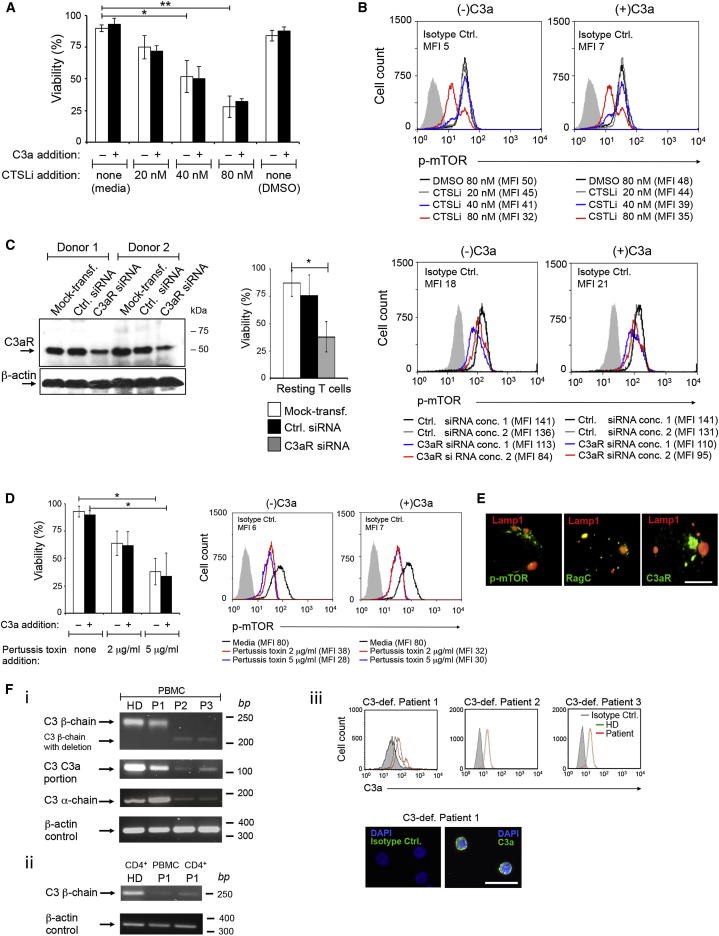
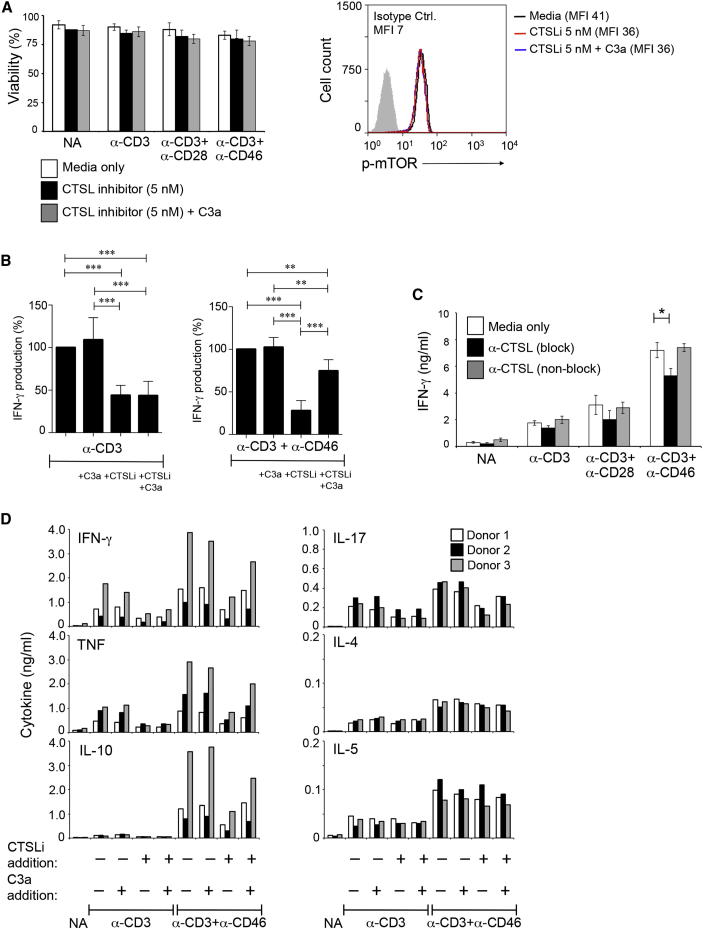
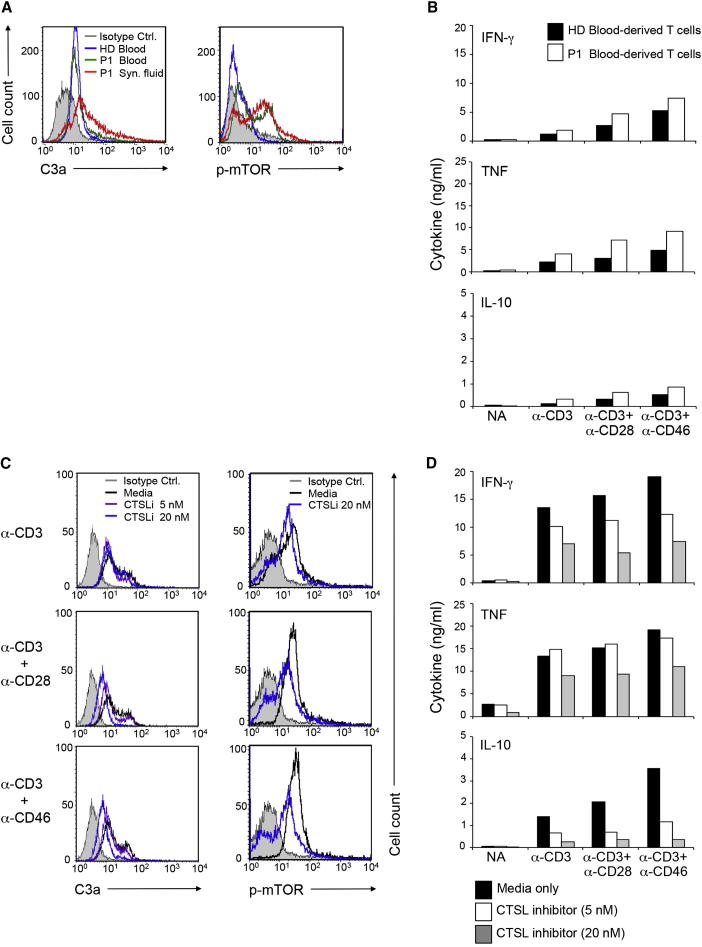
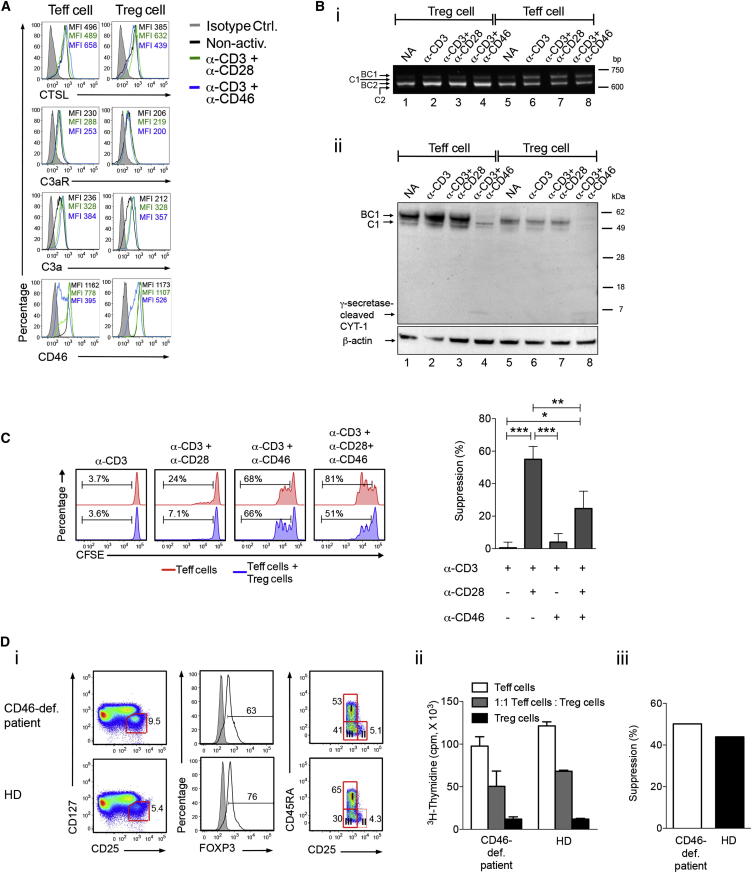
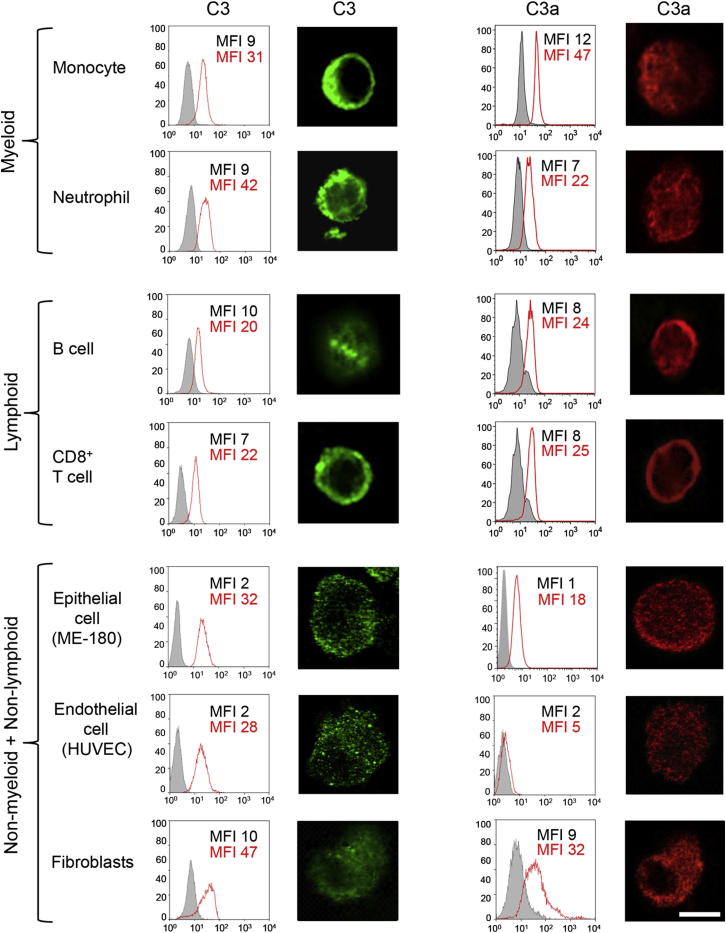
Complement is viewed as a critical serum-operative component of innate immunity, with processing of its key component, C3, into activation fragments C3a and C3b confined to the extracellular space. We report here that C3 activation also occurred intracellularly. We found that the T cell-expressed protease cathepsin L (CTSL) processed C3 into biologically active C3a and C3b. Resting T cells contained stores of endosomal and lysosomal C3 and CTSL and substantial amounts of CTSL-generated C3a. While "tonic" intracellular C3a generation was required for homeostatic T cell survival, shuttling of this intracellular C3-activation-system to the cell surface upon T cell stimulation induced autocrine proinflammatory cytokine production. Furthermore, T cells from patients with autoimmune arthritis demonstrated hyperactive intracellular complement activation and interferon-γ production and CTSL inhibition corrected this deregulated phenotype. Importantly, intracellular C3a was observed in all examined cell populations, suggesting that intracellular complement activation might be of broad physiological significance.


Figures

None
Graphical abstract
Figure 1
Figure 1
Resting Human CD4+ T Cells Contain Stores of C3 and C3-Activating Cathepsin L (A) CTSL-mediated C3 cleavage in the presence of CTSL inhibitors, including a chemical inhibitor, a function-blocking (Ab1) and a non-function-blocking antibody to CTSL (Ab2) and analysis by immunoblotting for C3 cleavage components. (B) CTSL-mediated cleavage of C3 generates C3a. C3 incubation with CTSL (50, 100, and 200 ng) generates C3a detected by silver staining (left panel) and immunoblotting with two anti-C3a antibodies to cleaved C3a and C3a contained in the C3 α chain (right panel). (C) T cells contain mRNAs coding for C3, CTSL, and the C3a receptor (C3aR). Data shown in (A)–(C) are representative of three experiments (n = 3). (D) Resting CD4+ T cells contain intracellular C3 and CTSL as assessed by flow cytometry analysis. (E) Subcellular localization of C3 and CTSL stores assessed by confocal microscopy. Scale bars represent 10 μM. (D and E) are representative of n = 5 experiments. Clnx, calnexin, endoplasmic reticulum marker; EEAI, early endosomal vesicle marker; Lamp1, lysosomal marker; MFI, mean fluorescence intensity; Rab5, late endosomal vesicle marker. (I, magnification ×60; II to VII, magnification ×100). See also Figure S1.
Figure 2
Figure 2
CTSL Generates Intracellular and Extracellular C3a (A) C3a generation in resting and activated T cells (1 hr) in the presence of different CTSL-blocking reagents: a chemical CTSL inhibitor (CTSLi), a function-blocking (block), and a non-function-blocking antibody to CTSL (non-block) (left panel). Expression of CTSL, C3b, and C3aR was also measured but without addition of CTSL-blocking reagents (right panels). Shown are representative data of three independently performed experiments (n = 3). (B and C) C3b and C3a and their respective receptors translocate and colocalize upon T cell activation. Nonactivated or anti-CD3 and anti-CD46-activated T cells, permeabilized and stained for C3, CTSL, C3a, C3aR, and CD46 in the combinations depicted and analyzed by confocal microscopy (B). Shown are two representative staining examples side-by-side for each condition from eight similarly performed experiments with a different donor each time (n = 8). Scale bar represents 5 μM. (C) Statistical analysis ± SD for colocalization events of the proteins assessed under (B) with Pearson’s Correlation Coefficient method. (Magnification ×100). p < 0.05. See also Figure S2.
Figure 3
Figure 3
CD4+ T Cell Survival Is Dependent on CTSL-Mediated C3 Processing and Intracellular C3aR Signaling (A and B) Viability (A) and mTOR activation (B) in resting T cells with increasing amounts of CTSL inhibitor with or without concurrent addition of C3a (100 ng/ml) at 12 hr postaddition of reagents. (C) Effect of C3aR-specific siRNA (left panel) on viability (middle panel) and mTOR activity (right panel) in nonactivated T cells 24 hr after transfection. (D) Effect of GPCR inhibition with pertussis toxin on viability (left panel) and mTOR activation (right panel) with and without C3a addition. Data ± SD shown are derived from three independently performed experiments (n = 3). (E) Confocal microscopy analysis for C3aR, mTOR, and RagC expression and colocalization in resting CD4+ T cells (n = 2). Scale bar represents 5 μM. (F) C3 mRNA and intracellular C3a protein in cells from serum C3-deficient patients. (Fi) C3 mRNA in peripheral blood mononuclear cells (PBMCs) from three serum C3-deficient patients (P1, P2 and P3) and a healthy donor (HD). (Fii) Comparison of C3 mRNA between PBMCs and CD4+ T cells from P1. Other C3 primer pairs gave similar results (data not shown). (Fiii) Activated C3 (intracellular C3a) in purified CD4+ T cells from C3-deficient Patients 1, 2, and 3. CD4+ T cells from Patient 1 were also assessed for C3a presence by confocal microscopy (two panels below). Scale bar represents 25 μM. Data (±SD) are from three experiments (n = 3) in (A)–(D). (E) ×100 magnification and (Fiii, lower panels) ×60 magnification. Conc., concentration; Ctrl. siRNA, control siRNA; Mock-transf., mock-transfected. p < 0.05; ∗∗p < 0.005. See also Figure S3.
Figure 4
Figure 4
Th1 and Th17 Cell Induction Requires Cell Surface Activation of CD46 and C3aR by CTSL-Generated C3 Activation Fragments (A and B) C3a supplementation rescues CTSL inhibitor (CTSLi)-mediated diminution of Th1 cell induction. CD4+ T cells were stimulated as shown in media with 5 nM CTSLi with or without addition of C3a (100 ng/ml). (A) 5 nM CTSL inhibitor leaves cell viability (see Figure S4B) and mTOR activity (right panel) unaffected. (B) IFN-γ production by cells activated under these conditions was measured 36 hr after activation with IFN-γ production by CD3- (left panel) or CD3+CD46-activated cells (right panel) set at 100%. (C) Effect of anti-CTSL function-blocking or function-non-blocking antibodies on Th1 cell induction. (D) Effects of CTSL inhibition on Th2 and Th17 cell-mediated responses. Experiments were performed as described under (A) and (B) and production of indicated cytokines measured 36 hr after activation. Data ± SD are from five independent experiments (n = 5) in (A)–(C) and from three independent experiments in (D) with results shown as mean values of conditions performed in duplicate (n = 3). See also Figure S4.
Figure 5
Figure 5
Enhanced Cytokine Production by T Cells in the Synovial Fluid from a Patient with Juvenile Arthritis Is Normalized by CTSL Inhibition (A) CD4+ T cells from blood of a healthy donor (HD) or blood and synovial fluid (Syn. fluid) of a patient with juvenile arthritis (JA) were assessed for intracellular C3a and mTOR immediately after purification. (B) Cytokine production of the stimulated HD and JA P1 peripheral blood T cells were assessed at 18 hr postactivation. (C) Intracellular C3a and activated mTOR amounts and (D) cytokine production of stimulated T cells from synovial fluid of JA P1 in presence of shown CTSL inhibitor (CTSLi) concentrations assessed at 18 hr. The addition of 5 nM CTSLi had no effect on cell viability. Supplementation of media with 20 nM CTSLi had no effect on nonactivated and CD3-activated cells and reduced cell viability by 5% (±2.7%) in CD3 + CD28 and CD3 + CD46-activated cells (not shown). Data represent mean values of conditions performed in duplicate. See also Figure S5.
Figure 6
Figure 6
Effector and Regulatory T Cells Engage Distinct Complement Receptor Pathways (A) CTSL and complement protein expression in regulatory (Treg) and effector (Teff) T cells in resting and activated (1 hr) states. (B) CD46 mRNA (i) and protein expression (ii) in resting and activated (12 hr) Treg and Teff cells. (C) Effect of CD46 activation on Treg cell suppressive activity at a 1:1 Treg:Teff cell ratio. Results shown in (A)–(C) are derived from three independent experiments (n = 3) with the mean ± SD (C). BC1, C1, BC2, and C2 refer to the proteins forms and differently spliced mRNAs coding for the four protein isoforms of CD46. The mRNAs for C1 and C2 in (Bi) and the γ-secretase-processed CYT-1 of CD46 in (Bii) give weak signals at this exposure time but are clearly visible upon overexposure (data not shown). (D) Phenotype of Treg cells from a CD46-deficient (CD46-def.) patient and age- and sex-matched healthy controls (HD). Shown are (i) percentage of bulk CD4+CD25hiCD127lo Treg cells, FOXP3 expression and percentages of Treg cell subpopulations I (CD4+CD25hiCD127loCD45RA+), III (CD4+CD25hiCD127loCD45RA), and II (CD4+CD25brightCD127loCD45RA+), (ii) suppressive function of Treg cells via 3H-thymidine incorporation measurement in 1:1 coculture, and (iii) calculated percentage suppression with mean values ± SD. p < 0.05; ∗∗p < 0.01; ∗∗∗p < 0.005. See also Figure S6.
Figure 7
Figure 7
Intracellular C3 Stores and “Tonic” Intracellular C3a Generation Occurs in Myeloid, Lymphoid, and Nonmyeloid, Nonlymphoid Cell Populations Freshly isolated monocytes, neutrophils, CD8+ T cells, B cells, and cultured epithelial cells, endothelial cells, and fibroblasts were assessed for presence of intracellular C3b by flow cytometry and confocal microscopy image analyses (first and second column of panels, respectively), as well as for C3a (third and fourth column of panels, respectively) in the resting state. Results shown are representative of three independently performed experiments (n = 3). Scale bar represents 10 μM. MFI, mean fluorescence intensity.

Comment in

Similar articles

Cited by

References

    1. André C., Cota D. Coupling nutrient sensing to metabolic homoeostasis: the role of the mammalian target of rapamycin complex 1 pathway. Proc. Nutr. Soc. 2012;71:502–510. - PubMed
    1. Cardone J., Le Friec G., Vantourout P., Roberts A., Fuchs A., Jackson I., Suddason T., Lord G., Atkinson J.P., Cope A. Complement regulator CD46 temporally regulates cytokine production by conventional and unconventional T cells. Nat. Immunol. 2010;11:862–871. - PMC - PubMed
    1. Chen G., Shaw M.H., Kim Y.-G., Nuñez G. NOD-like receptors: role in innate immunity and inflammatory disease. Annu. Rev. Pathol. 2009;4:365–398. - PubMed
    1. Couzi L., Contin-Bordes C., Marliot F., Sarrat A., Grimal P., Moreau J.-F., Merville P., Fremeaux-Bacchi V. Inherited deficiency of membrane cofactor protein expression and varying manifestations of recurrent atypical hemolytic uremic syndrome in a sibling pair. Am. J. Kidney Dis. 2008;52:e5–e9. - PubMed
    1. Dehrmann F.M., Coetzer T.H., Pike R.N., Dennison C. Mature cathepsin L is substantially active in the ionic milieu of the extracellular medium. Arch. Biochem. Biophys. 1995;324:93–98. - PubMed

Publication types