

Analysis of the human tissue-specific expression by genome-wide integration of transcriptomics and antibody-based proteomics
- PMID: 24309898
- PMCID: PMC3916642
- DOI: 10.1074/mcp.M113.035600
Analysis of the human tissue-specific expression by genome-wide integration of transcriptomics and antibody-based proteomics
Abstract
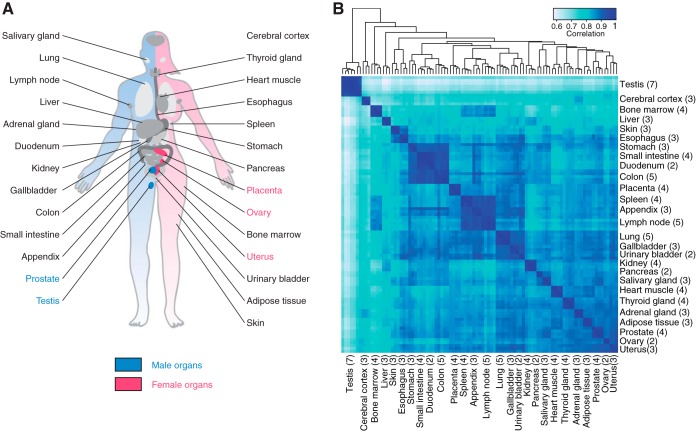
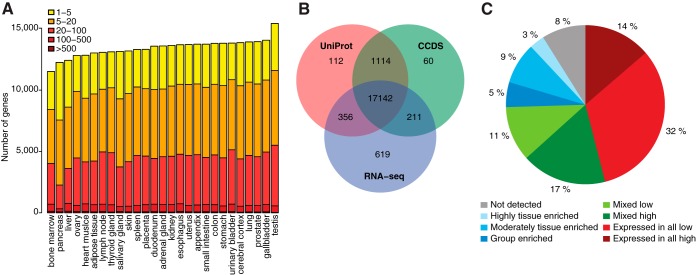
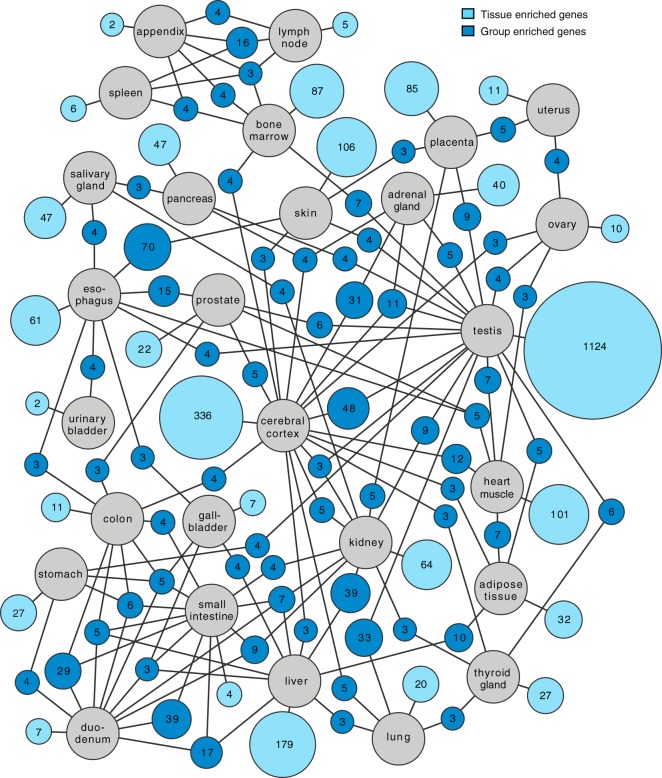
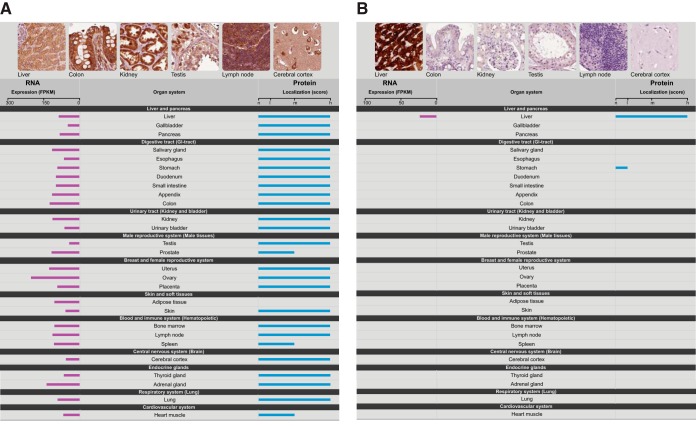
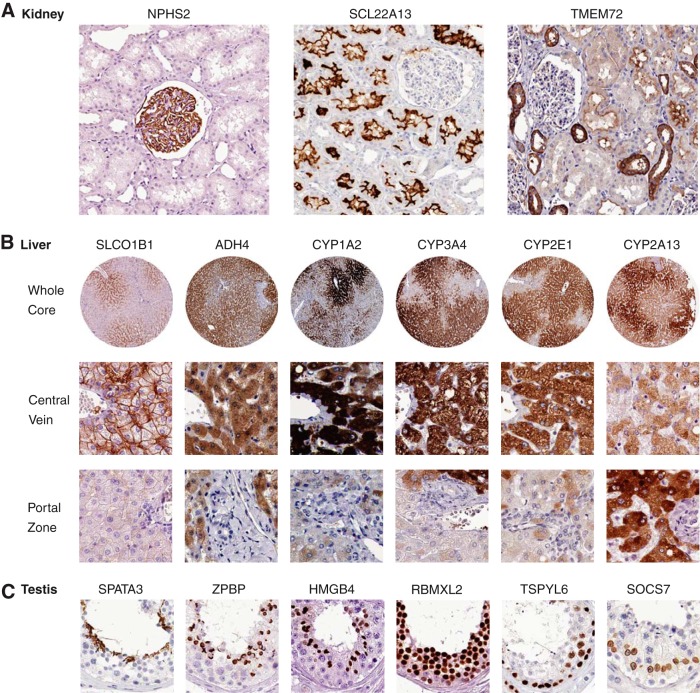
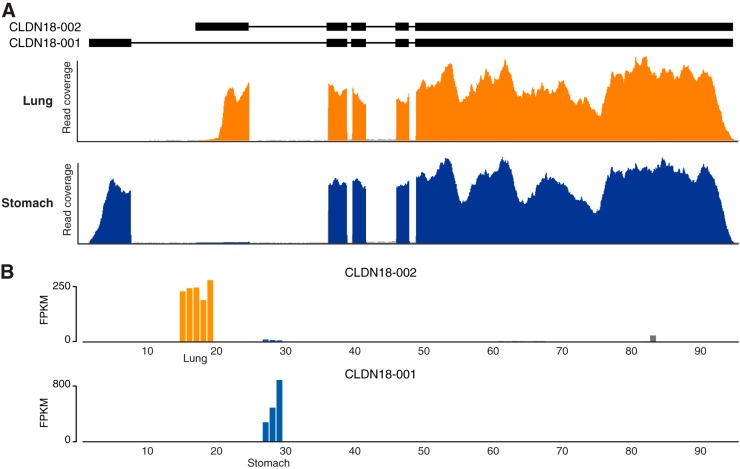
Global classification of the human proteins with regards to spatial expression patterns across organs and tissues is important for studies of human biology and disease. Here, we used a quantitative transcriptomics analysis (RNA-Seq) to classify the tissue-specific expression of genes across a representative set of all major human organs and tissues and combined this analysis with antibody-based profiling of the same tissues. To present the data, we launch a new version of the Human Protein Atlas that integrates RNA and protein expression data corresponding to ∼80% of the human protein-coding genes with access to the primary data for both the RNA and the protein analysis on an individual gene level. We present a classification of all human protein-coding genes with regards to tissue-specificity and spatial expression pattern. The integrative human expression map can be used as a starting point to explore the molecular constituents of the human body.
Conflict of interest statement
Author Information. The authors declare that they have no conflict of interest. Correspondence and requests for materials should be addressed to MU (
Figures
Similar articles
-
Evolutionary hallmarks of the human proteome: chasing the age and coregulation of protein-coding genes.BMC Genomics. 2016 Oct 25;17(Suppl 8):725. doi: 10.1186/s12864-016-3062-y. BMC Genomics. 2016. PMID: 27801289 Free PMC article.
-
RNA- and antibody-based profiling of the human proteome with focus on chromosome 19.J Proteome Res. 2014 Apr 4;13(4):2019-27. doi: 10.1021/pr401156g. Epub 2014 Mar 12. J Proteome Res. 2014. PMID: 24579871
-
The Human Endometrium-Specific Proteome Defined by Transcriptomics and Antibody-Based Profiling.OMICS. 2015 Nov;19(11):659-68. doi: 10.1089/omi.2015.0115. Epub 2015 Oct 21. OMICS. 2015. PMID: 26488136
-
Transcriptomics resources of human tissues and organs.Mol Syst Biol. 2016 Apr 4;12(4):862. doi: 10.15252/msb.20155865. Mol Syst Biol. 2016. PMID: 27044256 Free PMC article. Review.
-
Systems biology of human atherosclerosis.Vasc Endovascular Surg. 2014 Jan;48(1):5-17. doi: 10.1177/1538574413510628. Epub 2013 Nov 7. Vasc Endovascular Surg. 2014. PMID: 24212404 Review.
Cited by
-
Maternal Serum and Placental Metabolomes in Association with Prenatal Phthalate Exposure and Neurodevelopmental Outcomes in the MARBLES Cohort.Metabolites. 2022 Sep 2;12(9):829. doi: 10.3390/metabo12090829. Metabolites. 2022. PMID: 36144233 Free PMC article.
-
Angiotensin-converting enzyme 2 expression is not induced by the renin-angiotensin system in the lung.ERJ Open Res. 2020 Oct 5;6(4):00402-2020. doi: 10.1183/23120541.00402-2020. eCollection 2020 Oct. ERJ Open Res. 2020. PMID: 33043048 Free PMC article.
-
Ensemble machine learning identifies genetic loci associated with future worsening of disability in people with multiple sclerosis.Sci Rep. 2022 Nov 11;12(1):19291. doi: 10.1038/s41598-022-23685-w. Sci Rep. 2022. PMID: 36369345 Free PMC article.
-
Review of rationale and progress toward targeting cyclin-dependent kinase 2 (CDK2) for male contraception†.Biol Reprod. 2020 Aug 4;103(2):357-367. doi: 10.1093/biolre/ioaa107. Biol Reprod. 2020. PMID: 32543655 Free PMC article. Review.
-
Endogenous Retrovirus-Derived lncRNA BANCR Promotes Cardiomyocyte Migration in Humans and Non-human Primates.Dev Cell. 2020 Sep 28;54(6):694-709.e9. doi: 10.1016/j.devcel.2020.07.006. Epub 2020 Aug 6. Dev Cell. 2020. PMID: 32763147 Free PMC article.
References
-
- Paik Y. K., Jeong S. K., Omenn G. S., Uhlen M., Hanash S., Cho S. Y., Lee H. J., Na K., Choi E. Y., Yan F., Zhang F., Zhang Y., Snyder M., Cheng Y., Chen R., Marko-Varga G., Deutsch E. W., Kim H., Kwon J. Y., Aebersold R., Bairoch A., Taylor A. D., Kim K. Y., Lee E. Y., Hochstrasser D., Legrain P., Hancock W. S. (2012) The Chromosome-Centric Human Proteome Project for cataloging proteins encoded in the genome. Nat. Biotechnol. 30, 221–223 - PubMed
Publication types
MeSH terms
Substances
LinkOut - more resources
Full Text Sources
Other Literature Sources
Molecular Biology Databases
