. 2013 Aug 15;4(3):437-44.
doi: 10.1016/j.celrep.2013.07.012. Epub 2013 Aug 8.

CDK8-mediated STAT1-S727 phosphorylation restrains NK cell cytotoxicity and tumor surveillance

Affiliations

CDK8-mediated STAT1-S727 phosphorylation restrains NK cell cytotoxicity and tumor surveillance

Eva Maria Putz et al. Cell Rep. .

Abstract

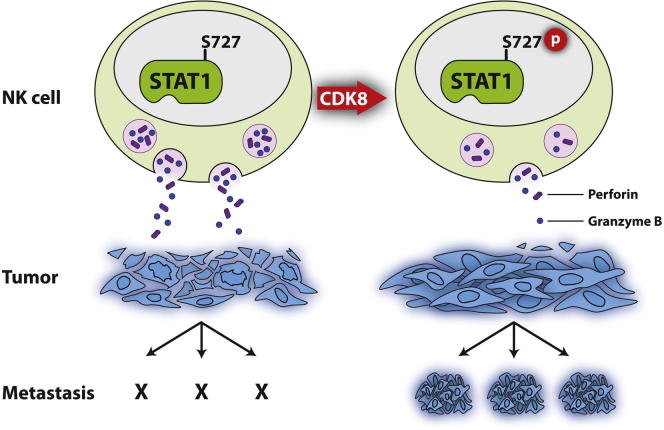
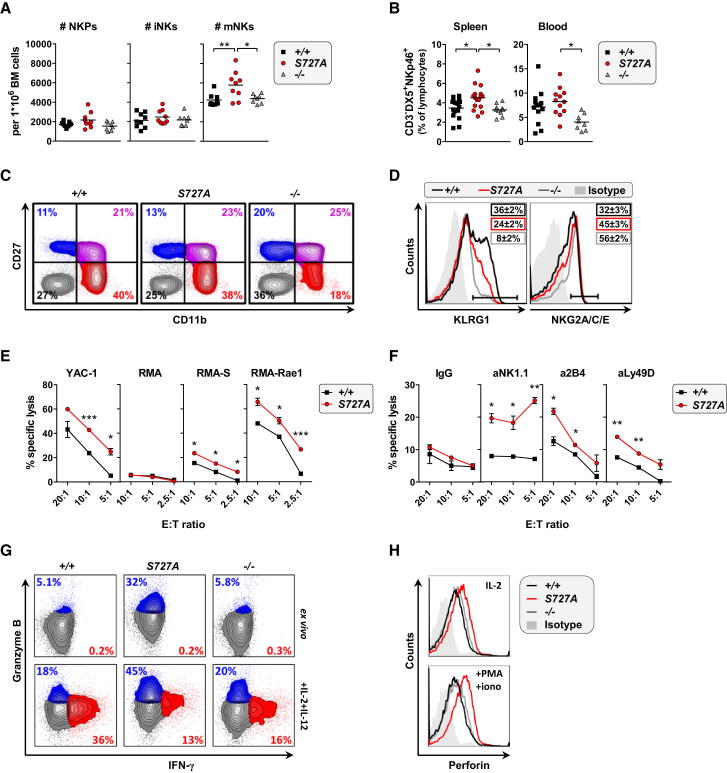
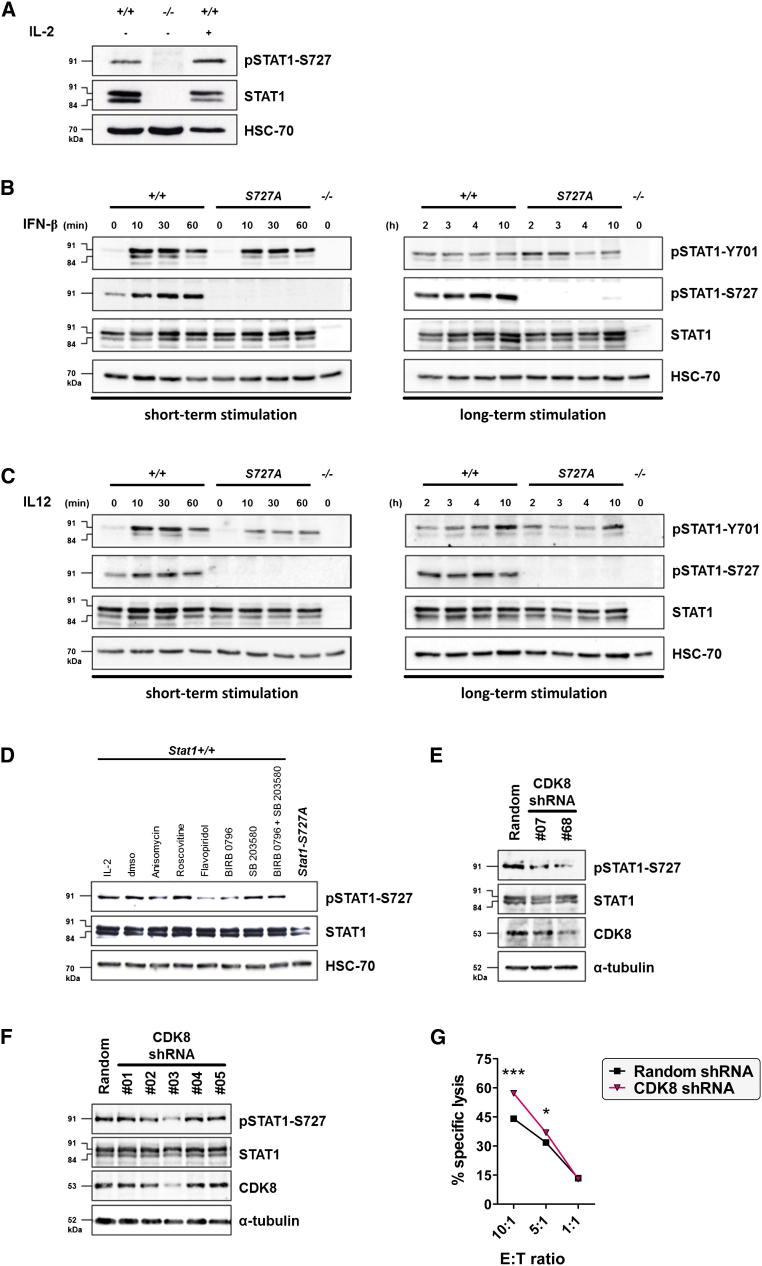
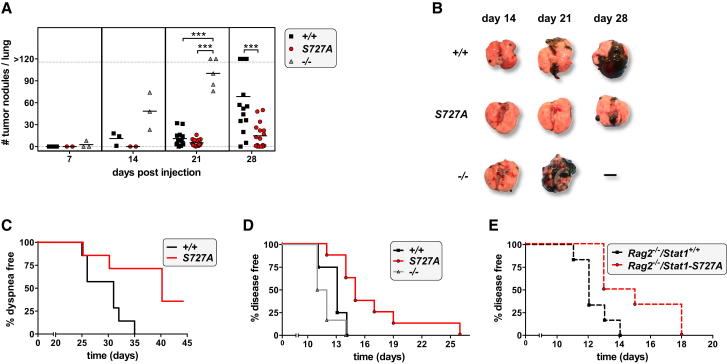
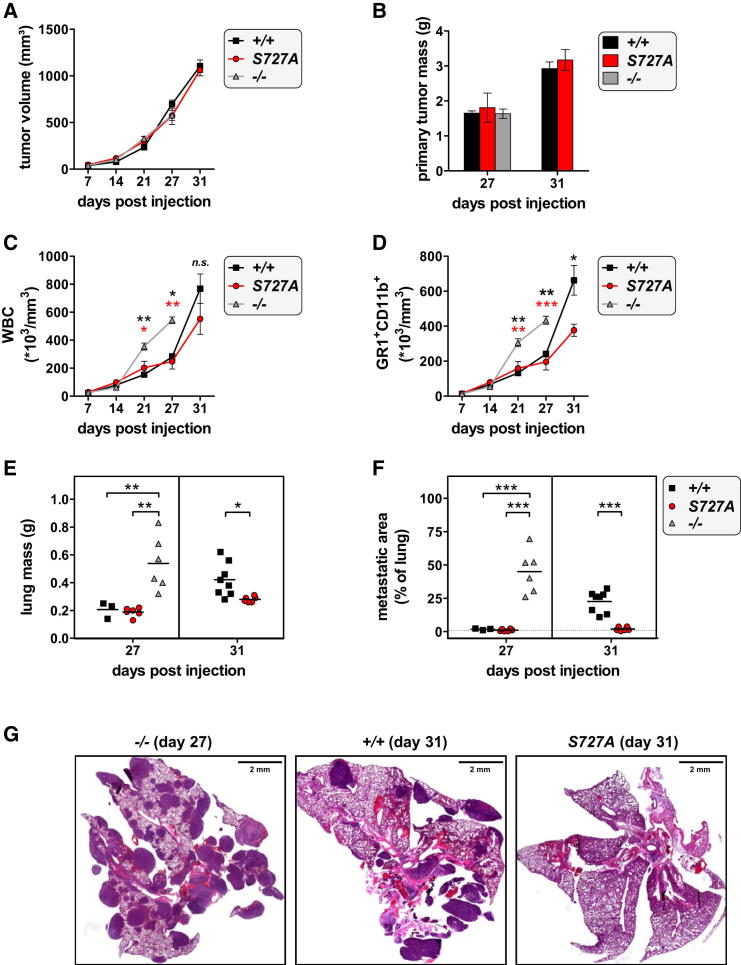
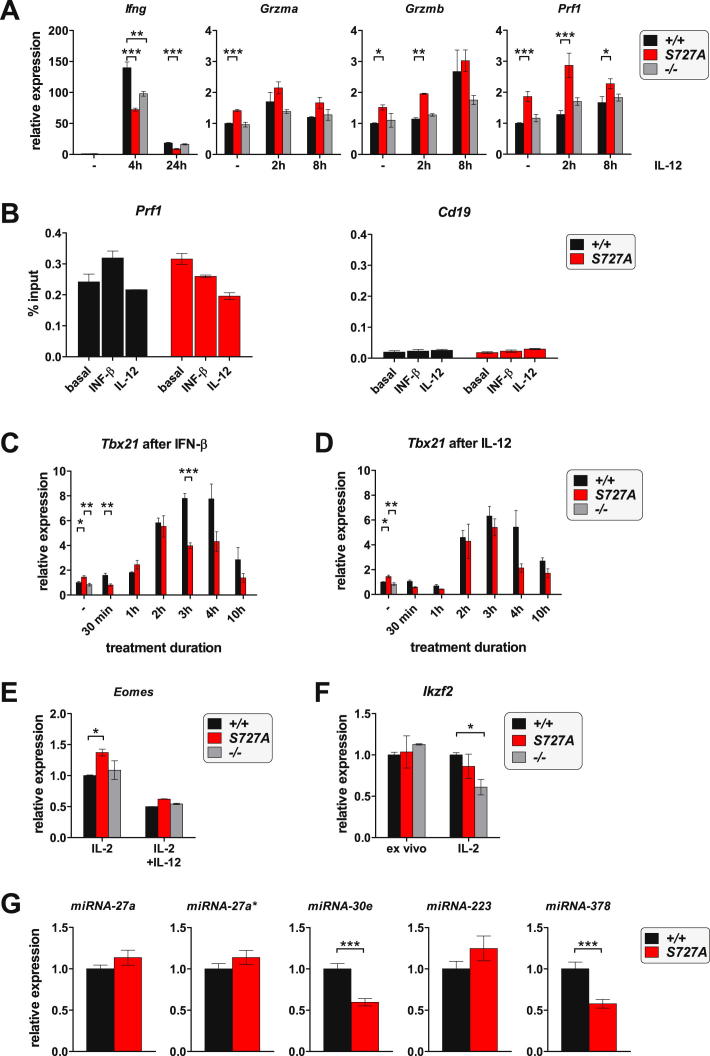
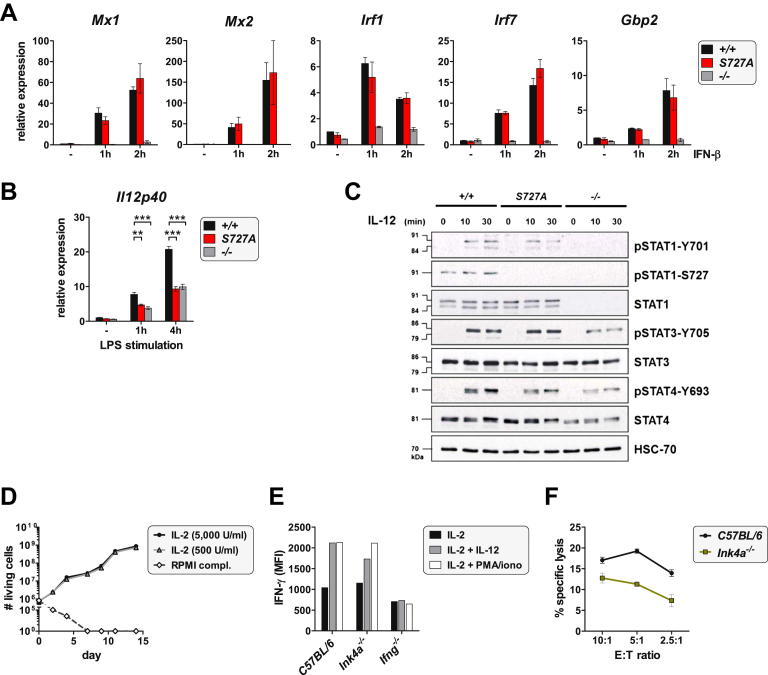
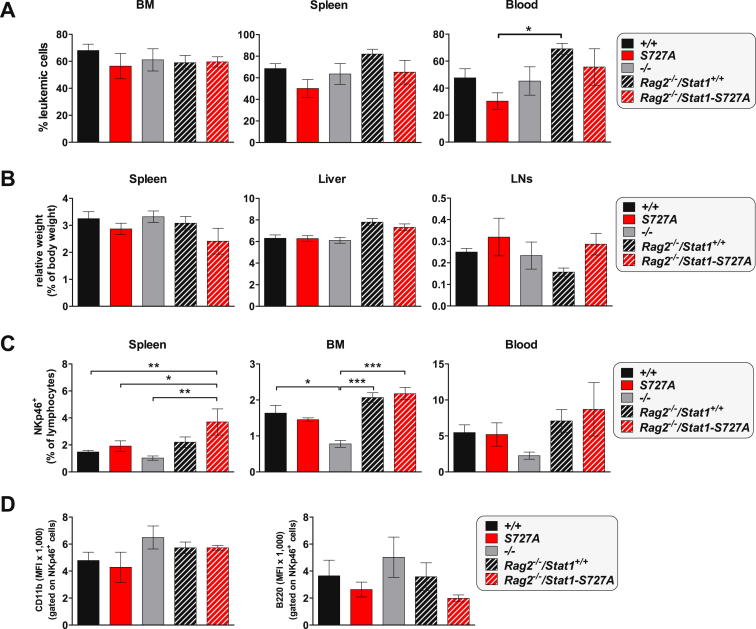
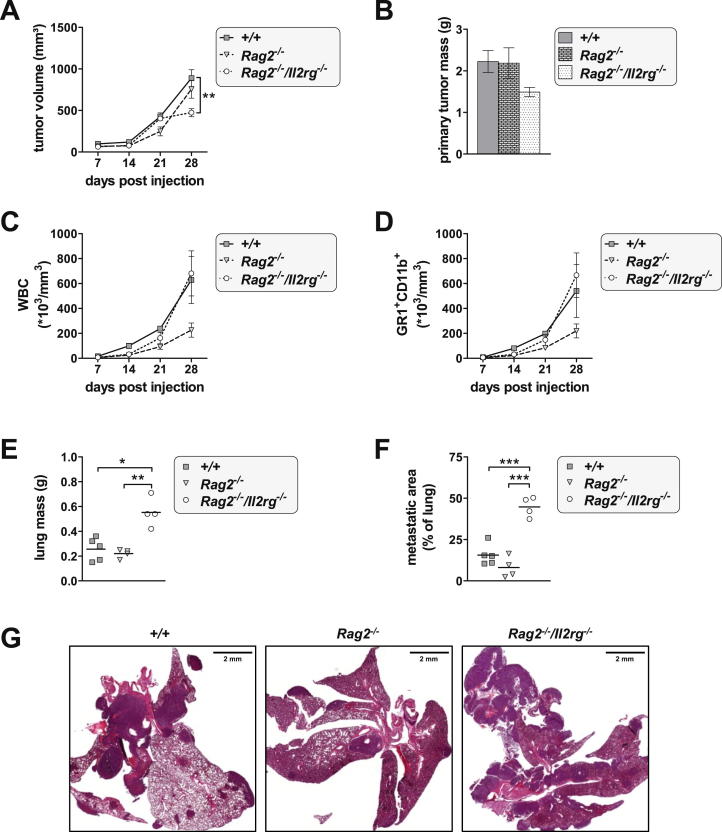
The transcription factor STAT1 is important in natural killer (NK) cells, which provide immediate defense against tumor and virally infected cells. We show that mutation of a single phosphorylation site (Stat1-S727A) enhances NK cell cytotoxicity against a range of tumor cells, accompanied by increased expression of perforin and granzyme B. Stat1-S727A mice display significantly delayed disease onset in NK cell-surveilled tumor models including melanoma, leukemia, and metastasizing breast cancer. Constitutive phosphorylation of S727 depends on cyclin-dependent kinase 8 (CDK8). Inhibition of CDK8-mediated STAT1-S727 phosphorylation may thus represent a therapeutic strategy for stimulating NK cell-mediated tumor surveillance.


Figures

None
Graphical abstract
Figure 1
Figure 1
Presence, Development, and Cytotoxic Function of Stat1-S727A NK Cells (A) Bone marrow was investigated for NK cell precursors (NKPs, CD3Ter-119GR1B220CD122+NK1.1DX5), immature NK cells (iNKs, CD3Ter-119GR1B220CD122+NK1.1+DX5), and mNKs (CD3Ter-119GR1B220CD122+NK1.1+DX5+). Each symbol represents an individual mouse; small horizontal lines indicate the mean (p < 0.05, ∗∗p < 0.01; one-way ANOVA and Tukey’s post hoc test). (B) Number of CD3DX5+NKp46+ NK cells, given as percentages of spleen and blood lymphocytes, is shown. Each symbol represents an individual mouse; horizontal lines indicate the mean (p < 0.05; one-way ANOVA and Tukey’s post hoc test). (C) NK cell maturation profiles represented by the expression of CD27 and CD11b on CD3NK1.1+ splenocytes are shown. Data are representative for at least five independent experiments with n > 10 for each genotype. (D) Expression of KLRG1 and NKG2A/C/E on CD3DX5+NK1.1+NKp46+ splenocytes is shown. Numbers indicate the percentage of gate+ (horizontal line) NK cells ± SEM; n ≥ 9 for each genotype. (E) Cytotoxicity of wild-type versus Stat1-S727A NK cells against YAC-1, RMA, RMA-S, and RMA-Rae1 tumor targets at given effector-to-target (E:T) ratios, measured in a 4 hr [51Cr]-release cytotoxicity assay is shown. Symbols represent means, and error bars indicate SEM of triplicates (p < 0.05, ∗∗∗p < 0.001; unpaired t test). Data are representative of three independent experiments. (F) R-ADCC against FcR+ Daudi target cells crosslinked with antibodies against NK1.1, 2B4, and Ly49D is shown. Symbols represent means, and error bars indicate SEM of triplicates (p < 0.05, ∗∗p < 0.01; unpaired t test). Data are representative of two independent experiments. (G) IFN-γ and granzyme B protein expression in splenic NK cells (gated on CD3NKp46+) ex vivo and after 4 hr stimulation with IL-2 and IL-12 is presented. (H) LAK cells stained intracellularly for perforin under normal culturing conditions and after 4 hr treatment with PMA and ionomycin are shown. See also Figure S1 and Table S1.
Figure 2
Figure 2
Constitutive Basal STAT1-S727 Phosphorylation in NK Cells Is Mediated by CDK8 (A) Western blot of freshly isolated DX5+ splenocytes from wild-type animals shows constitutive basal phosphorylation on STAT1-S727 in vivo. (B and C) In vitro-expanded LAK cells from wild-type and Stat1-S727A mice were treated with or without (B) 100 U/ml IFN-β or (C) 5 ng/ml IL-12 for the given times, and the phosphorylation on STAT1-Y701 and STAT1-S727 was investigated by western blot. Stat1−/− LAK cells served as negative control and HSC-70 as loading control. (D) Wild-type LAK cells were treated with different kinase inhibitors targeting CDKs (roscovitine and flavopiridol) or MAPK p38 (BIRB 0796 and SB 203580), and the phosphorylation status of STAT1-S727 was determined in a western blot. (E) CDK8 knockdown in primary NK cells with two hairpins led to reduced STAT1-S727 phosphorylation. A random hairpin served as control. (F) Knockdown of CDK8 with five hairpins in an immortalized Ink4a−/− NK cell line is shown. A random hairpin served as control. (G) FACS-based cytotoxicity assay of immortalized NK cells transduced with a random hairpin or a hairpin against CDK8 (#3) against YAC-1 target cells is presented. Symbols represent mean, and error bars indicate SEM of triplicates (p < 0.05, ∗∗∗p < 0.001; unpaired t test). See also Figure S2.
Figure 3
Figure 3
Stat1-S727A Mice Are Less Susceptible to B16F10 Melanoma and v-abl+ Leukemic Cells (A) Wild-type, Stat1-S727A, and Stat1−/− mice were injected intravenously with B16F10 melanoma cells. At the indicated time points, mice were sacrificed, and tumor nodules visible on the lung surface were counted. Each symbol represents an individual mouse; horizontal lines indicate the mean (∗∗∗p < 0.001, one-way ANOVA and Tukey’s post hoc test on day 21, unpaired t test on day 28). (B) Representative lung photographs at the indicated time points after injection of B16F10 melanoma cells are shown. (C) Kaplan-Meier plot of wild-type (n = 7) and Stat1-S727A (n = 7) mice intravenously injected with B16F10 melanoma cells is illustrated. Log rank testing revealed a significant difference in the onset of dyspnea (p = 0.027; MST wild-type = 31 days; MST Stat1-S727A = 40 days). (D) Kaplan-Meier plot of wild-type (n = 8), Stat1-S727A (n = 8), and Stat1−/− (n = 6) recipient animals inoculated intravenously with v-abl+ leukemic cells is presented. Stat1-S727A mice succumb to leukemia with an increased latency (MST = 15 days) than wild-type (MST = 13 days) and Stat1−/− (MST = 11.5 days) animals. Log rank test was corrected with Bonferroni for multiple testing and revealed a significant difference between Stat1-S727A and wild-type (p = 0.0053) and between Stat1-S727A and Stat1−/− animals (p = 0.0023). (E) Kaplan-Meier plot of Rag2−/−/Stat1+/+ (n = 6) and Rag2−/−/Stat1-S727A (n = 6) animals injected intravenously with v-abl+ leukemic cells is shown. Rag2−/−/Stat1-S727A mice succumb to leukemia with increased latency (MST = 14 days) than Rag2−/−/Stat1+/+ (MST = 12 days) animals. Log rank test was statistically significant (p = 0.017). See also Figure S3.
Figure 4
Figure 4
Stat1-S727A Mice Are Resistant to 4T1 Breast Cancer Metastasis into Lungs Wild-type (n = 11), Stat1-S727A (n = 12), and Stat1−/− (n = 6) animals received orthotopical transplants of 4T1 breast cancer cells. (A) Primary tumor volumes were measured weekly. Symbols represent mean, and error bars indicate SEM. (B) Some recipients were sacrificed at day 27 (wild-type n = 3, Stat1-S727A n = 6, Stat1−/− n = 6) and remaining recipients at day 31, then the primary tumors were weighed. Bar graph depicts mean ± SEM. (C and D) Recipient mice were bled weekly, and (C) WBCs and (D) MDSCs (GR1+CD11b+) were counted (p < 0.05, ∗∗p < 0.01, ∗∗∗p < 0.001; one-way ANOVA and Tukey’s post hoc test on days 21 and 27; unpaired t test on day 31). Symbols represent means, and error bars indicate SEM. n.s., not significant. (E and F) After termination of the experiment, (E) lungs were weighed, and (F) the percentage (%) of metastatic area in the lung was determined histochemically (p < 0.05, ∗∗p < 0.01, ∗∗∗p < 0.001; one-way ANOVA and Tukey’s post hoc test on day 27; unpaired t test on day 31). Each symbol represents an individual mouse; horizontal lines indicate the mean. (G) Representative H&E-stained lung sections of Stat1−/− animals at day 27 and wild-type and Stat1-S727A animals at day 31 post transplantation are shown. See also Figure S4.
Figure S1
Figure S1
Effect of Stat1-S727A Mutation on the Transcription of Effector Molecules, Related to Figure 1 and Table S2 (A) mRNA expression of Ifng (IFN-γ), Grzma (granzyme A), Grzmb (granzyme B) and Prf1 (perforin) were measured in LAK cells derived from wild-type, Stat1-S727A and Stat1−/− animals under standard culturing conditions and after IL-12 stimulation (p < 0.05, ∗∗p < 0.01, ∗∗∗p < 0.001; one-way ANOVA and Tukey’s post hoc test). The summary of at least 3 independent LAK cell preparations is depicted; all values were normalized to untreated wild-type LAK cells. (B) The recruitment of polymerase II to the Prf1 gene was investigated via ChIP in wild-type and Stat1-S727A LAK cells under standard culturing conditions (basal) and after 30 min stimulation with 100 U/ml IFN-β or 5 ng/ml IL-12 (left panel). Polymerase II binding to the B lymphocyte antigen gene Cd19 was determined as negative control (right panel). Plotted are means ± SEM. (C and D) In vitro expanded NK cells were stimulated for the indicated periods with 100 U/ml IFN-β (C) or 5 ng/ml IL-12 (D) and the expression level of Tbx21 (T-bet) was determined via semiquantitative real time PCR relative to Gapdh (p < 0.05, ∗∗p < 0.01, ∗∗∗p < 0.001; one-way ANOVA and Tukey's post hoc test). (E) The mRNA level of Eomes (Eomesodermin) was measured in expanded NK cells and after 8 hr stimulation with 5 ng/ml IL-12 (p < 0.05; one-way ANOVA and Tukey's post hoc test). (F) Ikzf2 (Helios) mRNA was quantified in freshly isolated splenic NK cells and after 7 days in culture. All values are normalized to untreated wild-type NK cells. Depicted is the summary of at least two independent experiments (p < 0.05; one-way ANOVA followed by Tukey’s post hoc test). (G) The expression levels of miRNAs involved in the posttranscriptional regulation of perforin and granzyme B were determined in freshly isolated NK cells derived from wild-type and Stat1-S727A mice (n ≥ 3 per genotype, ∗∗∗p < 0.001; unpaired t test). Plotted are means ± SEM.
Figure S2
Figure S2
IL-12 and IFN-β Signaling and NK Cell Line Characterization, Related to Figure 2 and Table S2 (A) Transcription of Mx1, Mx2, Irf1, Irf7 and Gbp2 was investigated in isolated, cultivated LAK cells 1 and 2 hr after the treatment with 100 U/ml IFN-β. mRNA levels were measured via semiquantitative real time PCR relative to Gapdh. All values were normalized to untreated wild-type LAK cells. Stat1−/− LAK cells failed to induce appreciable mRNA levels upon IFN-β stimulation, whereas Stat1-S727A LAK cells did not show any difference compared to wild-type. Presented is the summary of 2 independent experiments with 3-6 replicates per group. Plotted are means ± SEM. (B) Splenocytes from wild-type, Stat1-S727A and Stat1−/− mice (2 per group) were prepared and subjected to LPS stimulation (100 ng/ml, 1 hr and 4 hr). Il12p40 mRNA expression was measured via semiquantitative real time PCR relative to Gapdh. All values were normalized to untreated wild-type LAK cells; shown are means ± SEM (∗∗p < 0.01, ∗∗∗p < 0.001; one-way ANOVA followed by Tukey’s post hoc test). (C) IL-12-induced STAT1, STAT3 and STAT4 activation in LAK cells derived from wild-type, Stat1-S727A and Stat1−/− animals. HSC-70 served as loading control. (D) Ink4a−/− splenic NK cells were MACS (DX5) purified, sorted for CD3-NK1.1+ expression and cultivated in vitro under standard conditions (5,000 U/ml IL-2) for several months. Proliferation assay of an immortal NK cell line cultivated under standard conditions, low dose of IL-2 (500 U/ml) and deprived from IL-2 (RPMI compl.). One week after IL-2 deprivation all NK cells underwent apoptosis. (E) Intracellular FACS staining for IFN-γ production in an Ink4a−/− NK cell line under normal culturing conditions (IL-2) or after stimulation for 4 hr with IL-12 or PMA and ionomycin, respectively. C57BL/6 LAK cells served as positive control, Ifng−/− LAK cells as negative control. (F) Cytotoxic capacity of an Ink4a−/− NK cell line against YAC-1 target cells measured in a FACS-based cytotoxicity assay. Ink4a−/− NK cell lines retained some cytotoxic capacity, although diminished compared to primary wild-type NK cells after 7 days in vitro cultivation. Symbols represent means, and error bars indicate SEM of triplicates.
Figure S3
Figure S3
Characterization of Diseased Mice after v-abl+ Leukemic Cell Transplantation, Related to Figure 3 Wild-type (n = 8), Stat1-S727A (n = 8), Stat1−/− (n = 6), Rag2−/− (n = 6) and Rag2−/−/Stat1-S727A mice (n = 6) were injected intravenously with 105v-abl+ leukemic cells. The mice were checked daily and sacrificed at the first sign of disease. As shown in Figure 3Stat1-S727A and Rag2−/−/Stat1-S727A mice survived the leukemic challenge with the longest latency. (A) At the respective day of sacrifice, all mice were investigated for the infiltration of CD19+CD43+B220+ leukemic tumor cells into bone marrow (BM), spleen and blood. Disease severity was comparable in all mice at the day of sacrifice. Depicted are means ± SEM (p < 0.05, one-way ANOVA and Tukey’s post hoc test). (B) Spleen, liver and lymph node (LN) weight, depicted relatively to the body weight, was measured and showed no difference. Plotted are means ± SEM. (C) Numbers of NKp46+ NK cells were measured in spleen, BM and blood of all animals. Depicted are means ± SEM (p < 0.05, ∗∗p < 0.01, ∗∗∗p < 0.001; one-way ANOVA followed by Tukey’s post hoc test). (D) To measure NK cell maturity and activation, the expression of CD11b (left hand) and B220 (right hand) was determined on NKp46+ NK cells, respectively. There were no significant differences detectable. Depicted are means ± SEM. This experiment was conducted with 3 different v-abl+ cell lines with comparable results.
Figure S4
Figure S4
4T1 Breast Cancer Metastasis Formation in Immune-Compromised Rag2−/− and Rag2−/−/Il2rg−/− Animals, Related to Figure 4 BALB/c wild-type (n = 5), Rag2−/− (n = 4) and Rag2−/−/Il2rg−/− (n = 4) animals received orthotopical transplants of 4T1 breast cancer cells. (A) Breast tumor volumes were measured weekly. Symbols represent means and error bars indicate SEM. Rag2−/−/Il2rg−/− animals seemed to develop smaller breast tumors, which was due to increased intra-tumoral necrosis (∗∗p < 0.01; one-way ANOVA and Tukey's post hoc test). (B–D) After sacrifice at day 28 post transplantation, primary tumors were prepared and weighed. Plotted are means ± SEM. No significant differences in primary tumor weight were detected. Recipient mice were bled weekly and (C) white blood cell (WBC) counts and (D) the numbers of myeloid-derived suppressor cells (MDSCs, GR1+CD11b+) were determined as surrogate marker of disease progression. Rag2−/− animals showed substantially lower WBC and MDSC counts at day 28 post injection. Symbols represent means and error bars indicate SEM. (E and F) After termination of the experiment, (E) lungs were weighed and (F) the percentage of metastatic area in the lung was determined histochemically (p < 0.05, ∗∗p < 0.01, ∗∗∗p < 0.001; one-way ANOVA and Tukey’s post hoc test). Each symbol represents an individual mouse; small horizontal lines indicate the mean. (G) Representative H&E-stained lung sections of wild-type, Rag2−/− and Rag2−/−/Il2rg−/− animals.

Similar articles

  • Selective and Potent CDK8/19 Inhibitors Enhance NK-Cell Activity and Promote Tumor Surveillance.
    Hofmann MH, Mani R, Engelhardt H, Impagnatiello MA, Carotta S, Kerenyi M, Lorenzo-Herrero S, Böttcher J, Scharn D, Arnhof H, Zoephel A, Schnitzer R, Gerstberger T, Sanderson MP, Rajgolikar G, Goswami S, Vasu S, Ettmayer P, Gonzalez S, Pearson M, McConnell DB, Kraut N, Muthusamy N, Moll J. Hofmann MH, et al. Mol Cancer Ther. 2020 Apr;19(4):1018-1030. doi: 10.1158/1535-7163.MCT-19-0789. Epub 2020 Feb 5. Mol Cancer Ther. 2020. PMID: 32024684 Free PMC article.
  • NK Cell-Specific CDK8 Deletion Enhances Antitumor Responses.
    Witalisz-Siepracka A, Gotthardt D, Prchal-Murphy M, Didara Z, Menzl I, Prinz D, Edlinger L, Putz EM, Sexl V. Witalisz-Siepracka A, et al. Cancer Immunol Res. 2018 Apr;6(4):458-466. doi: 10.1158/2326-6066.CIR-17-0183. Epub 2018 Jan 31. Cancer Immunol Res. 2018. PMID: 29386186
  • CDK8 kinase phosphorylates transcription factor STAT1 to selectively regulate the interferon response.
    Bancerek J, Poss ZC, Steinparzer I, Sedlyarov V, Pfaffenwimmer T, Mikulic I, Dölken L, Strobl B, Müller M, Taatjes DJ, Kovarik P. Bancerek J, et al. Immunity. 2013 Feb 21;38(2):250-62. doi: 10.1016/j.immuni.2012.10.017. Epub 2013 Jan 24. Immunity. 2013. PMID: 23352233 Free PMC article.
  • STAT1 Isoforms Differentially Regulate NK Cell Maturation and Anti-tumor Activity.
    Meissl K, Simonović N, Amenitsch L, Witalisz-Siepracka A, Klein K, Lassnig C, Puga A, Vogl C, Poelzl A, Bosmann M, Dohnal A, Sexl V, Müller M, Strobl B. Meissl K, et al. Front Immunol. 2020 Sep 11;11:2189. doi: 10.3389/fimmu.2020.02189. eCollection 2020. Front Immunol. 2020. PMID: 33042133 Free PMC article.
  • STAT1-S727 - the license to kill.
    Putz EM, Gotthardt D, Sexl V. Putz EM, et al. Oncoimmunology. 2014 Dec 13;3(9):e955441. doi: 10.4161/21624011.2014.955441. eCollection 2014 Oct. Oncoimmunology. 2014. PMID: 25941617 Free PMC article.

Cited by

References

    1. Bancerek J., Poss Z.C., Steinparzer I., Sedlyarov V., Pfaffenwimmer T., Mikulic I., Dölken L., Strobl B., Müller M., Taatjes D.J., Kovarik P. CDK8 kinase phosphorylates transcription factor STAT1 to selectively regulate the interferon response. Immunity. 2013;38:250–262. - PMC - PubMed
    1. Bromberg J.F., Horvath C.M., Wen Z., Schreiber R.D., Darnell J.E., Jr. Transcriptionally active Stat1 is required for the antiproliferative effects of both interferon alpha and interferon gamma. Proc. Natl. Acad. Sci. USA. 1996;93:7673–7678. - PMC - PubMed
    1. Cao X., Shores E.W., Hu-Li J., Anver M.R., Kelsall B.L., Russell S.M., Drago J., Noguchi M., Grinberg A., Bloom E.T. Defective lymphoid development in mice lacking expression of the common cytokine receptor gamma chain. Immunity. 1995;2:223–238. - PubMed
    1. Dalton D.K., Pitts-Meek S., Keshav S., Figari I.S., Bradley A., Stewart T.A. Multiple defects of immune cell function in mice with disrupted interferon-gamma genes. Science. 1993;259:1739–1742. - PubMed
    1. Davis M.I., Hunt J.P., Herrgard S., Ciceri P., Wodicka L.M., Pallares G., Hocker M., Treiber D.K., Zarrinkar P.P. Comprehensive analysis of kinase inhibitor selectivity. Nat. Biotechnol. 2011;29:1046–1051. - PubMed

Supplemental References

    1. Alcaide P., Jones T.G., Lord G.M., Glimcher L.H., Hallgren J., Arinobu Y., Akashi K., Paterson A.M., Gurish M.A., Luscinskas F.W. Dendritic cell expression of the transcription factor T-bet regulates mast cell progenitor homing to mucosal tissue. J. Exp. Med. 2007;204:431–439. - PMC - PubMed
    1. Farlik M., Reutterer B., Schindler C., Greten F., Vogl C., Müller M., Decker T. Nonconventional initiation complex assembly by STAT and NF-kappaB transcription factors regulates nitric oxide synthase expression. Immunity. 2010;33:25–34. - PMC - PubMed
    1. Fehniger T.A., Wylie T., Germino E., Leong J.W., Magrini V.J., Koul S., Keppel C.R., Schneider S.E., Koboldt D.C., Sullivan R.P. Next-generation sequencing identifies the natural killer cell microRNA transcriptome. Genome Res. 2010;20:1590–1604. - PMC - PubMed
    1. Gratz N., Siller M., Schaljo B., Pirzada Z.A., Gattermeier I., Vojtek I., Kirschning C.J., Wagner H., Akira S., Charpentier E., Kovarik P. Group A streptococcus activates type I interferon production and MyD88-dependent signaling without involvement of TLR2, TLR4, and TLR9. J. Biol. Chem. 2008;283:19879–19887. - PMC - PubMed
    1. Kamezaki K., Shimoda K., Numata A., Matsuda T., Nakayama K.I., Harada M. The role of Tyk2, Stat1 and Stat4 in LPS-induced endotoxin signals. Int. Immunol. 2004;16:1173–1179. - PubMed

Publication types

MeSH terms