

Adverse outcomes in clear cell renal cell carcinoma with mutations of 3p21 epigenetic regulators BAP1 and SETD2: a report by MSKCC and the KIRC TCGA research network
- PMID: 23620406
- PMCID: PMC3708609
- DOI: 10.1158/1078-0432.CCR-12-3886
Adverse outcomes in clear cell renal cell carcinoma with mutations of 3p21 epigenetic regulators BAP1 and SETD2: a report by MSKCC and the KIRC TCGA research network
Abstract
Purpose: To investigate the impact of newly identified chromosome 3p21 epigenetic tumor suppressors PBRM1, SETD2, and BAP1 on cancer-specific survival (CSS) of 609 patients with clear cell renal cell carcinoma (ccRCC) from 2 distinct cohorts.
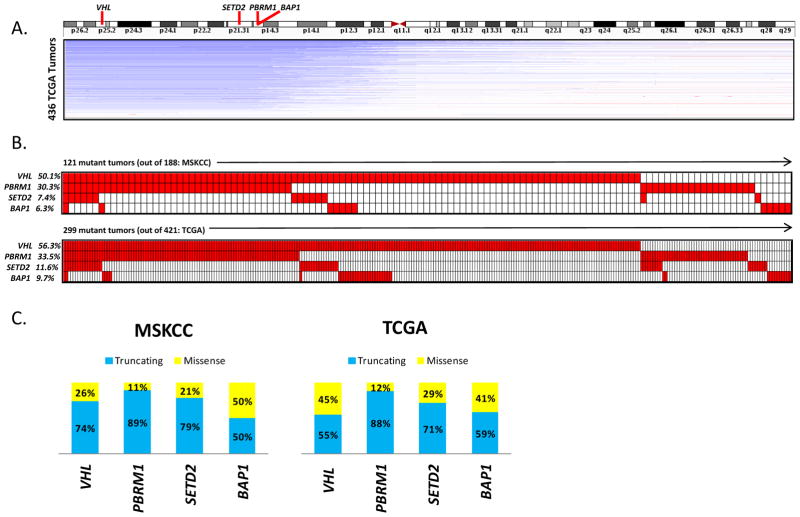
Experimental design: Select sequencing on 3p tumor suppressors of 188 patients who underwent resection of primary ccRCC at the Memorial Sloan-Kettering Cancer Center (MSKCC) was conducted to interrogate the genotype-phenotype associations. These findings were compared with analyses of the genomic and clinical dataset from our nonoverlapping The Cancer Genome Atlas (TCGA) cohort of 421 patients with primary ccRCC.
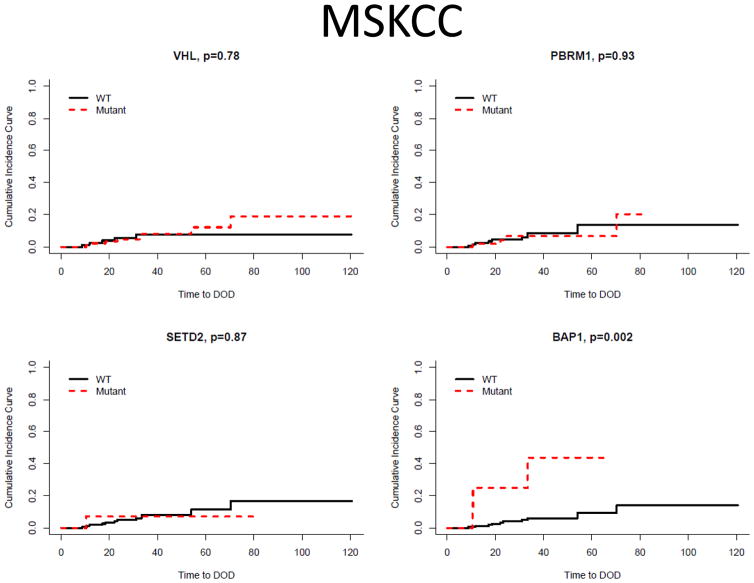
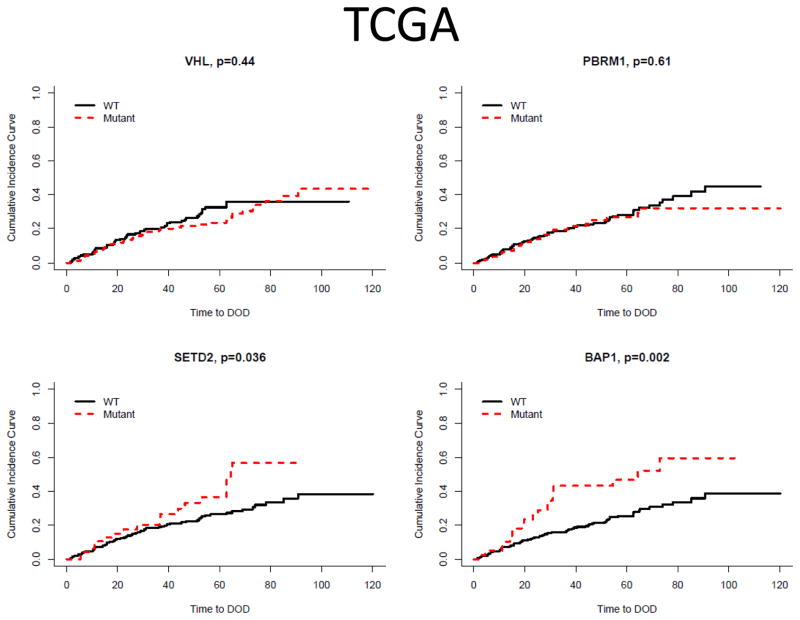
Results: 3p21 tumor suppressors are frequently mutated in both the MSKCC (PBRM1, 30.3%; SETD2, 7.4%; BAP1, 6.4%) and the TCGA (PBRM1, 33.5%; SETD2, 11.6%; BAP1, 9.7%) cohorts. BAP1 mutations are associated with worse CSS in both cohorts [MSKCC, P = 0.002; HR 7.71; 95% confidence interval (CI)2.08-28.6; TCGA, P = 0.002; HR 2.21; 95% CI 1.35-3.63]. SETD2 are associated with worse CSS in the TCGA cohort (P = 0.036; HR 1.68; 95% CI 1.04-2.73). On the contrary, PBRM1 mutations, the second most common gene mutations of ccRCC, have no impact on CSS.
Conclusion: The chromosome 3p21 locus harbors 3 frequently mutated ccRCC tumor suppressor genes. BAP1 and SETD2 mutations (6%-12%) are associated with worse CSS, suggesting their roles in disease progression. PBRM1 mutations (30%-34%) do not impact CSS, implicating its principal role in the tumor initiation. Future efforts should focus on therapeutic interventions and further clinical, pathologic, and molecular interrogation of this novel class of tumor suppressors.
Conflict of interest statement
Motzer - Consultancy from Pfizer; and Research Funding from Pfizer, Novartis, Glaxo Smith Kline, Bristol-Myers Squibb, Aveo and Eisai.
Figures
Similar articles
-
Aberrant promoter hypermethylation of PBRM1, BAP1, SETD2, KDM6A and other chromatin-modifying genes is absent or rare in clear cell RCC.Epigenetics. 2013 May;8(5):486-93. doi: 10.4161/epi.24552. Epub 2013 May 1. Epigenetics. 2013. PMID: 23644518 Free PMC article.
-
Expression and Mutation Patterns of PBRM1, BAP1 and SETD2 Mirror Specific Evolutionary Subtypes in Clear Cell Renal Cell Carcinoma.Neoplasia. 2019 Feb;21(2):247-256. doi: 10.1016/j.neo.2018.12.006. Epub 2019 Jan 16. Neoplasia. 2019. PMID: 30660076 Free PMC article.
-
Loss of PBRM1 and BAP1 expression is less common in non-clear cell renal cell carcinoma than in clear cell renal cell carcinoma.Urol Oncol. 2015 Jan;33(1):23.e9-23.e14. doi: 10.1016/j.urolonc.2014.10.014. Epub 2014 Nov 24. Urol Oncol. 2015. PMID: 25465300 Free PMC article.
-
BAP1, PBRM1 and SETD2 in clear-cell renal cell carcinoma: molecular diagnostics and possible targets for personalized therapies.Expert Rev Mol Diagn. 2015;15(9):1201-10. doi: 10.1586/14737159.2015.1068122. Epub 2015 Jul 11. Expert Rev Mol Diagn. 2015. PMID: 26166446 Review.
-
The roles of chromatin-remodelers and epigenetic modifiers in kidney cancer.Cancer Genet. 2015 May;208(5):206-14. doi: 10.1016/j.cancergen.2015.02.008. Epub 2015 Feb 20. Cancer Genet. 2015. PMID: 25873528 Free PMC article. Review.
Cited by
-
Identification of mortality-risk-related missense variant for renal clear cell carcinoma using deep learning.Ther Adv Chronic Dis. 2021 Feb 15;12:2040622321992624. doi: 10.1177/2040622321992624. eCollection 2021. Ther Adv Chronic Dis. 2021. PMID: 33643601 Free PMC article.
-
Inherited Genetic Mutations and Polymorphisms in Malignant Mesothelioma: A Comprehensive Review.Int J Mol Sci. 2020 Jun 17;21(12):4327. doi: 10.3390/ijms21124327. Int J Mol Sci. 2020. PMID: 32560575 Free PMC article. Review.
-
Identification of molecular characteristics of FUT8 and alteration of core fucosylation in kidney renal clear cell cancer.Aging (Albany NY). 2024 Jan 25;16(3):2299-2319. doi: 10.18632/aging.205482. Epub 2024 Jan 25. Aging (Albany NY). 2024. PMID: 38277230 Free PMC article.
-
Discovering Biomarkers within the Genomic Landscape of Renal Cell Carcinoma.J Kidney. 2016 Feb;2(1):115. doi: 10.4172/jok.1000115. Epub 2016 Feb 25. J Kidney. 2016. PMID: 27104219 Free PMC article.
-
Genomically annotated risk model for advanced renal-cell carcinoma: a retrospective cohort study.Lancet Oncol. 2018 Dec;19(12):1688-1698. doi: 10.1016/S1470-2045(18)30648-X. Epub 2018 Nov 8. Lancet Oncol. 2018. PMID: 30416077 Free PMC article.
References
-
- Siegel R, Naishadham D, Jemal A. Cancer statistics, 2012. CA: a cancer journal for clinicians. 2012;62:10–29. - PubMed
-
- Sorbellini M, Kattan MW, Snyder ME, Reuter V, Motzer R, Goetzl M, et al. A postoperative prognostic nomogram predicting recurrence for patients with conventional clear cell renal cell carcinoma. The Journal of urology. 2005;173:48–51. - PubMed
-
- Frank I, Blute ML, Cheville JC, Lohse CM, Weaver AL, Zincke H. An outcome prediction model for patients with clear cell renal cell carcinoma treated with radical nephrectomy based on tumor stage, size, grade and necrosis: the SSIGN score. The Journal of urology. 2002;168:2395–400. - PubMed
-
- Thompson RH, Leibovich BC, Lohse CM, Cheville JC, Zincke H, Blute ML, et al. Dynamic outcome prediction in patients with clear cell renal cell carcinoma treated with radical nephrectomy: the D-SSIGN score. The Journal of urology. 2007;177:477–80. - PubMed
-
- Karakiewicz PI, Briganti A, Chun FK, Trinh QD, Perrotte P, Ficarra V, et al. Multi-institutional validation of a new renal cancer-specific survival nomogram. Journal of clinical oncology : official journal of the American Society of Clinical Oncology. 2007;25:1316–22. - PubMed
Publication types
MeSH terms
Substances
Grants and funding
LinkOut - more resources
Full Text Sources
Other Literature Sources
Medical
Miscellaneous
