. 2013 Jun;45(6):639-47.
doi: 10.1038/ng.2613. Epub 2013 Apr 21.

Mutations in TUBG1, DYNC1H1, KIF5C and KIF2A cause malformations of cortical development and microcephaly

Affiliations

Mutations in TUBG1, DYNC1H1, KIF5C and KIF2A cause malformations of cortical development and microcephaly

Karine Poirier et al. Nat Genet. 2013 Jun.

Erratum in

  • Nat Genet. 2013 Aug;45(8):962

Abstract

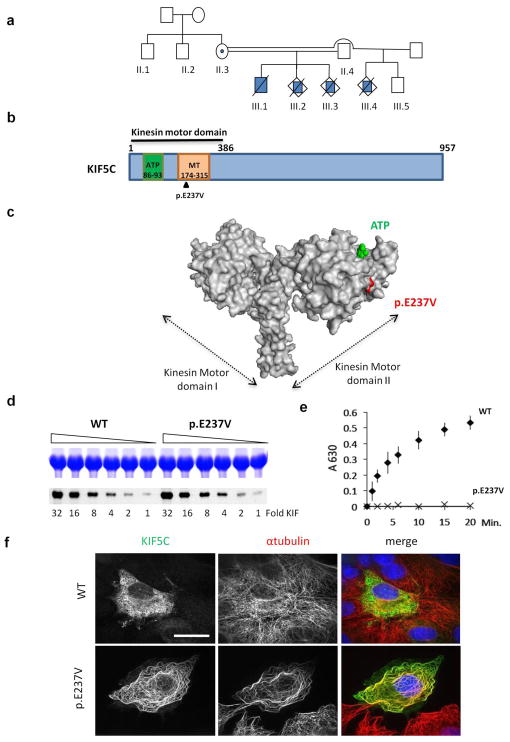
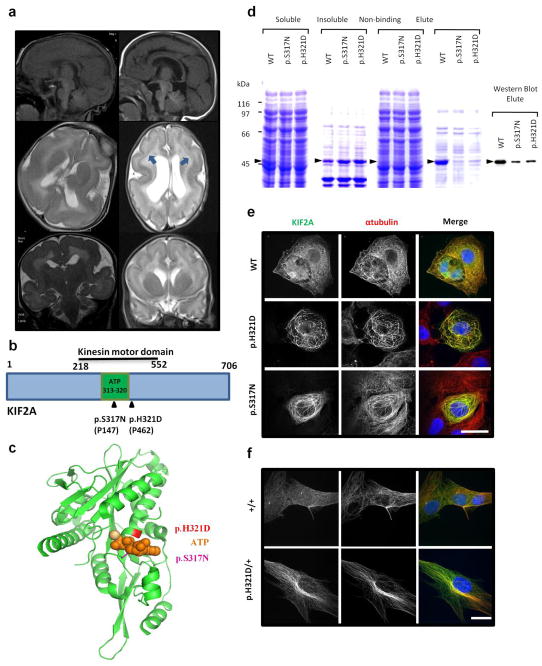
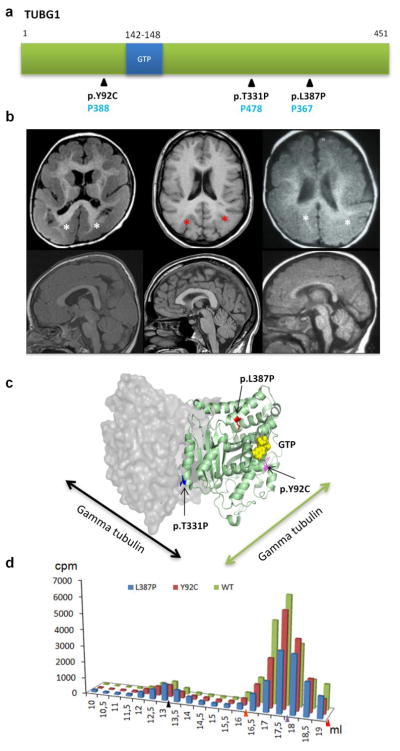
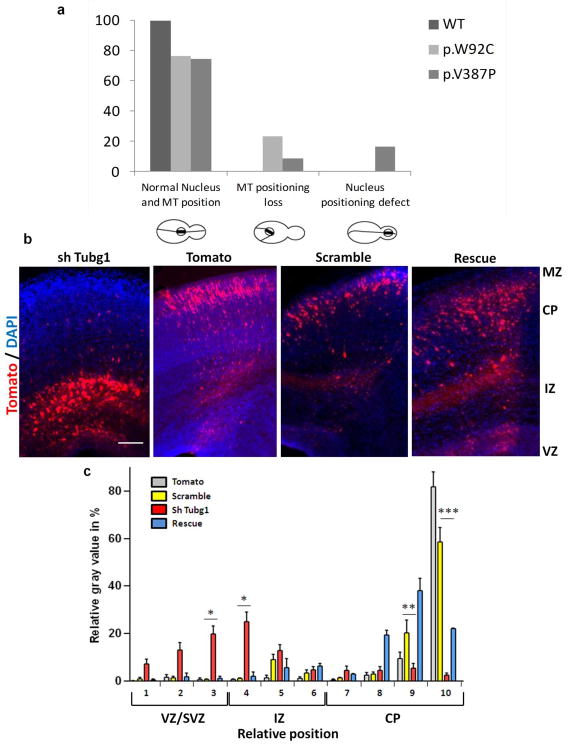
The genetic causes of malformations of cortical development (MCD) remain largely unknown. Here we report the discovery of multiple pathogenic missense mutations in TUBG1, DYNC1H1 and KIF2A, as well as a single germline mosaic mutation in KIF5C, in subjects with MCD. We found a frequent recurrence of mutations in DYNC1H1, implying that this gene is a major locus for unexplained MCD. We further show that the mutations in KIF5C, KIF2A and DYNC1H1 affect ATP hydrolysis, productive protein folding and microtubule binding, respectively. In addition, we show that suppression of mouse Tubg1 expression in vivo interferes with proper neuronal migration, whereas expression of altered γ-tubulin proteins in Saccharomyces cerevisiae disrupts normal microtubule behavior. Our data reinforce the importance of centrosomal and microtubule-related proteins in cortical development and strongly suggest that microtubule-dependent mitotic and postmitotic processes are major contributors to the pathogenesis of MCD.


Figures

Figure 1
Figure 1. Recurrent severe MCD resulting from a germline mosaic mutation in KIF5C and analysis of mutant KIF5C ATPase activity and cellular localization
(a) Pedigree of the P20 family with four affected male individuals exhibiting severe MCD (Supplementary Fig. 3d), (b) Linear schematic representation of the KIF5C showing the position of the mutation (c) 3D model of the rat kinesin dimer (generated by pyMol [pdb: 3kin]) showing the p.E237 residue (red) located at the motor domain surface. (d) microtubule binding assay of recombinant wild type and mutant KIF5C proteins. Upper part shows analysis of sedimented microtubules by SDS-PAGE (as loading controls); the lower part shows autoradiographs of the same gels. Note that the p.E237V mutation does not appreciably affect the protein’s ability to bind to microtubules. (e) Kinetics of microtubule-dependent ATP hydrolysis by wild type and mutant KIF5C proteins. The production of Pi was measured kinetically in reactions containing taxol-stabilized microtubules, an equal amount of purified recombinant KIF5C protein, and ATP using the malachite green colorimetric reaction. Diamonds and crosses represent wild type and mutant (p.E237V) proteins, respectively. Each time point represents the average of 6 experiments, +/− S.D. Note the complete absence of detectable ATP hydrolysis in the case of the p.E237V mutant protein. (f) Subcellular localization of transfected wild type and p.E237V mutant KIF5C in COS7 cells. KIF5C immunostaining (green) reveals a diffuse cytoplasmic distribution of wild type KIF5C with enrichment, as fluorescent puncta, along microtubules and in cortical regions of the cell, while mutant KIF5C heavily co-localises with and decorates microtubules (identified by α-tubulin labelling, shown in red) throughout the cell, but does not appear as puncta or accumulate in cortical clusters. Dapi was used as a counterstain to highlight nuclei. Scale bar 20 μm.
Figure 2
Figure 2. Mutations in KIF2A cause posterior predominant agyria/pachygyria and compromise productive folding and cellular localization
(a) Brain MRIs of patients with KIF2A mutations. Representative T1-Sagittal (first line), T2-axial (second line) and T2-coronal (third line) MRIs performed at 5 weeks in patient P147 and at 3 weeks in patient P462. Patient P147 (left hand column) shows posterior predominant agyria pachygyria, with a thick cortex and a thin corpus callosum. Patient P462 (right hand column) has posterior predominant pachygyria with subcortical band heterotopias (arrows) and a thin corpus callosum. (b–c) Linear and 3D ribbon (pdb: 2gry) representations of the kinesin 2A polypeptide showing the position of the two heterozygous MCD-associated mutations (shown in red and pink) near the nucleotide binding site (shown in orange). (d) Folding of KIF2A. Wild type and mutant (p.S317N, p.H321D) forms of the KIF2A nucleotide binding domain (amino acids 126 – 526) were expressed in E. coli as recombinant C-terminally His6-tagged proteins. Soluble extracts of host cells, the insoluble (particulate) fraction, and products that either failed to bind (non-binding) or bound and eluted (eluted) from columns of solid phase-bound Co++ were analysed by SDS-PAGE and (in the case of the affinity purified material) by Western blotting with an anti-His6 antibody. Arrow identifies the recombinant KIF2A nucleotide binding domain. The location of molecular mass markers is shown at the left. (e–f) Immunofluorescence staining of KIF2A (green) and α-tubulin (red) in either COS7 cells transfected with WT or mutant (p.S317N and p.H321D) KIF2A cDNA constructs (e) or in wild type and p.H321D patient-derived fibroblasts (f). Note that instead of the expected diffuse punctiform cytoplasmic and nuclear distribution (as observed for wild type KIF2A), KIF2A mutants showed a predominant co-localization with and decoration of microtubules. In cells expressing high levels of mutant forms of KIF2A, the decorated microtubule-network is mainly in the central region of the cells and around the nucleus with a disorganized and bundled appearance of microtubules. The nuclear distribution is also disrupted, and in the case of both mutants, the nucleus appears free of KIF2A. A similar altered distribution of KIF2A is evident in patient-derived fibroblasts. Scale bar 20 mm.
Figure 3
Figure 3. Spectrum of MCD associated with mutations in DYNC1H1 and analysis of the ability of mutant DYNC1H1 to bind to microtubules
(a) Schematic representation of DYNC1H1 protein showing the position of mutations causing MCD. (b) Brain MRI illustrations showing the phenotypic spectrum associated with DYNC1H1 mutations. Top line, P122: Axial T1-weighted images showing diffuse coarse PMG, most prominent in the perisylvian region (arrow head). In frontal regions, PMG has the appearance of a dysmorphic cortex (*). The sagittal T2-weighted section shows a dysmorphic thick corpus callosum and hypoplasic brainstem. Second line, P535: Axial T1-weighted images showing a simplified gyral pattern on both frontal regions (arrow heads), large and dysmorphic basal ganglia and parieto-occipital pachygyria (asterisks). Sagittal T1 weighted image shows a thick and dysmorphic corpus callosum. Third line, P398: Axial T1-weighted images showing bilateral frontal PMG (asterisks) with multiple small gyri giving an appearance of delicate PMG. (c) Illustration of the structure of the DYNC1H1 MTBD (ellipses) and the distal portion of the coiled-coil stalk of mouse cytoplasmic dynein as a fusion with seryl tRNA-synthetase (SRS, solid circle) from Thermus thermophilus (pdb: 3err). The Figure shows the surface location on the microtubule BD of p.K3336, p.R3344 and p.R3384 residues. (d) Effect of dynein heavy chain mutations on binding to MTs. Left panel: Coomassie stain of purified 35S-labeled wild type and mutant-containing seryl tRNA synthetase-DYNC1H1 MTBD fusion proteins analysed by SDS-PAGE. Right panels: purified labelled recombinant proteins (as shown on the left) were tested for their ability to co-sediment through sucrose cushions either in the presence (+Tub) or absence (-Tub) of taxol-polymerized MTs. Labelled material contained in the supernatants (S) and pellets (P) was analyzed by SDS-PAGE. Note that in the case of the mutant proteins, the amount of label sedimenting with MTs is reduced to a level close to that present in control reactions done without added tubulin.
Figure 4
Figure 4. Mutations in TUBG1 cause MCD with posterior predominant pachygyria and analysis of the effect of γ-tubulin mutations on facilitated folding
(a) Linear representation of the TUBG1 protein showing the localization of the GTP binding site and TUBG1 mutations. (b) Brain MRI illustrations of patients with mutations in TUBG1. Top line: Axial T1-weighted images in 3 different patients (respectively, P388, first column; P478 second column, and P367, third column) with different TUBG1 mutations show different degrees of pachygyria, with a thick cortex, most prominent in parieto-occipital regions (white asterisk). In the less severe case, pachygyria is milder with an aspect of posterior subcortical band heterotopia (red asterisk). Second line: Sagittal T1-weighted section showing a dysmorphic thick corpus callosum. Note that in the 3 cases, the cerebellum and brainstems are normal. (c) 3D model of the TUBG1 dimer (pdb: 3Cb2) showing the localization of the three mutated residues and the bound GTP molecule (yellow). (d) Effect of γ-tubulin mutations on facilitated folding. Sequences encoding full-length wild type and mutant (p.Y92C, p.L387P) γ-tubulin were expressed as 35S-labeled proteins in reticulocyte lysate and the reaction products analyzed by gel filtration on Superose 6. Fractions emerging from the column were subjected to SDS-PAGE and the radioactivity migrating as γ-tubulin quantified using a phosphorimager. Note the diminished yield of material migrating as monomeric γ-tubulin in the case of p.L387P, with a corresponding increase (relative to wild type) of radioactivity migrating as a binary complex with the cytosolic chaperonin (the CCT binary complex has the same apparent mass as the largest molecular mass marker, thyroglobulin, indicated by the black arrowhead). Arrows mark the elution position of molecular mass standards (thyroglobulin [black; 670kDa], IgG [orange; 158kDa], ovalbumin [purple; 44kDa], myoglobin [red; 17kDa]) run under identical conditions.
Figure 5
Figure 5. TUBG1 mutations affect mitotic figures in yeast cells and suppression of expression of Tubg1 disrupts neuronal migration in the developing mouse neocortex
(a) Yeast mitotic figures of γ-tubulin disease-related substitutions. At least 100 cells were examined in each strain after transformation with GFP-Bik1p, an α-tubulin binding protein that labels mitotic spindle and astral microtubules. The percentage of large budded cells with nuclei and microtubule positions were scored in the different strains as indicated. ***p<0.001 c2 test comparisons. (b) Validated shRNAs that suppressed Tubg1 expression in cultured N2A cells by approximately 50–60% were co-electroporated with an RFP-encoding reporter construct (Tomato) into progenitors cells located in the ventricular zone (VZ) of E14.5 mouse neocortices. The Figure shows examination of coronal sections of mouse brains 4 days after electroporation at E14.5 with an RFP-encoding vector (Tomato), control shRNA (Scramble), Tubg1 shRNA or Tubg1 shRNA in combination with pCMV6-Tubg1 (Rescue). (c) Fluorescence intensities reflecting distribution of electroporated cells within the cortex were converted into gray values and measured from the VZ to the MZ. Bars represent the mean ± SEM of fluorescence intensities in 10 equal strata (stratum 1 corresponding to the VZ and stratum 10 to the MZ) dividing the cortex of independent brains (Tomato n=4, Scramble n=3, sh Tubg1 n=11, Rescue n=2). Note that sh Tubg1 knockdown leads to an increase in the percentage of transfected cells located in the SVZ/IZ (strata 3 and 4) and a significant decrease in the upper layers of the CP (strata 9 and 10) compared with the Scramble control. Cells transfected with sh Tubg1 and pCMV6-Tubg1 have mainly reached the upper layers of the CP (strata 8 to 10), showing that migration disruption is a specific consequence of Tubg1 RNAi. Student t test: *p < 0.1, **p < 0.01 and ***p < 0.001. Scale bar: 100μm.

Similar articles

Cited by

References

    1. Caviness VS, Jr, Takahashi T, Nowakowski RS. Numbers, time and neocortical neuronogenesis: a general developmental and evolutionary model. Trends Neurosci. 1995;18:379–83. - PubMed
    1. Rakic P, Caviness VS., Jr Cortical development: view from neurological mutants two decades later. Neuron. 1995;14:1101–4. - PubMed
    1. Francis F, et al. Human disorders of cortical development: from past to present. Eur J Neurosci. 2006;23:877–93. - PubMed
    1. Guerrini R, Dobyns WB, Barkovich AJ. Abnormal development of the human cerebral cortex: genetics, functional consequences and treatment options. Trends Neurosci. 2008;31:154–62. - PubMed
    1. Barkovich AJ, Guerrini R, Kuzniecky RI, Jackson GD, Dobyns WB. A developmental and genetic classification for malformations of cortical development: update 2012. Brain: a journal of neurology. 2012;135:1348–69. - PMC - PubMed

Publication types

MeSH terms