. 2013 Jan 1;22(1):168-83.
doi: 10.1093/hmg/dds421. Epub 2012 Oct 3.

Determining consequences of retinal membrane guanylyl cyclase (RetGC1) deficiency in human Leber congenital amaurosis en route to therapy: residual cone-photoreceptor vision correlates with biochemical properties of the mutants

Affiliations

Determining consequences of retinal membrane guanylyl cyclase (RetGC1) deficiency in human Leber congenital amaurosis en route to therapy: residual cone-photoreceptor vision correlates with biochemical properties of the mutants

Samuel G Jacobson et al. Hum Mol Genet. .

Abstract

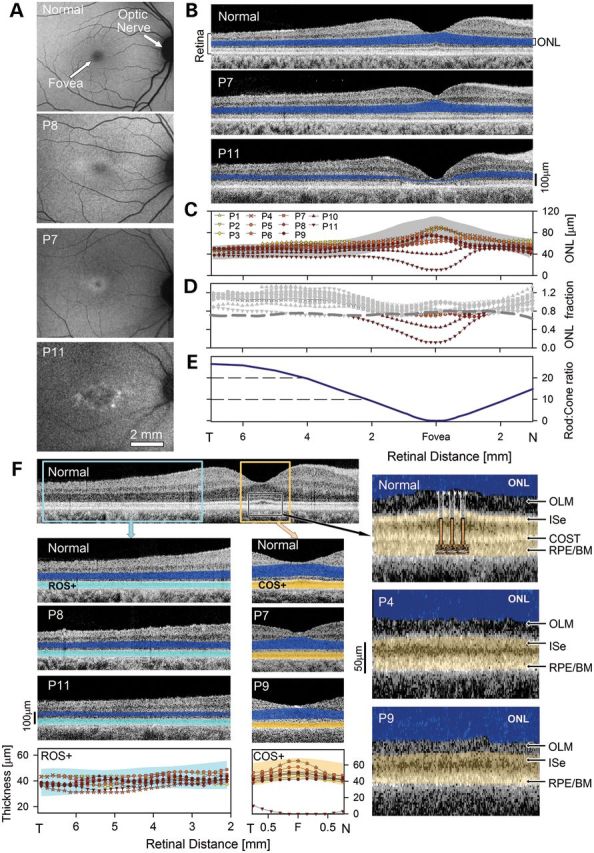
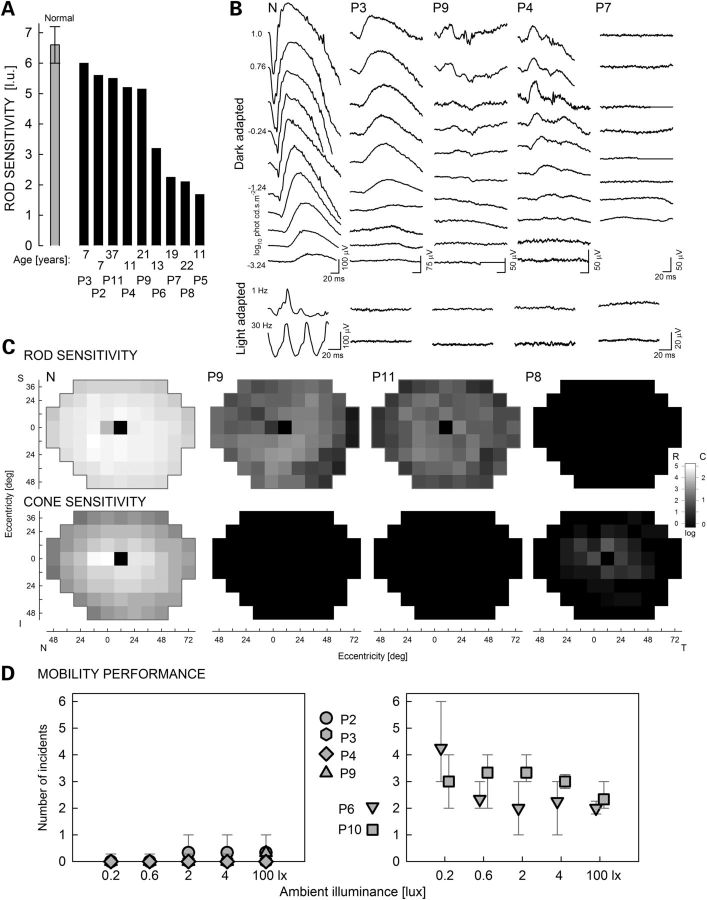
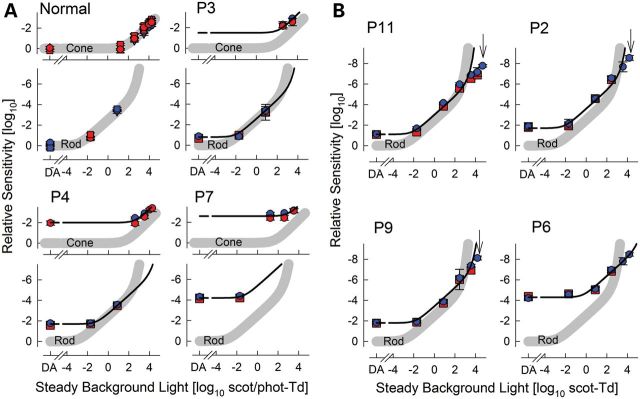
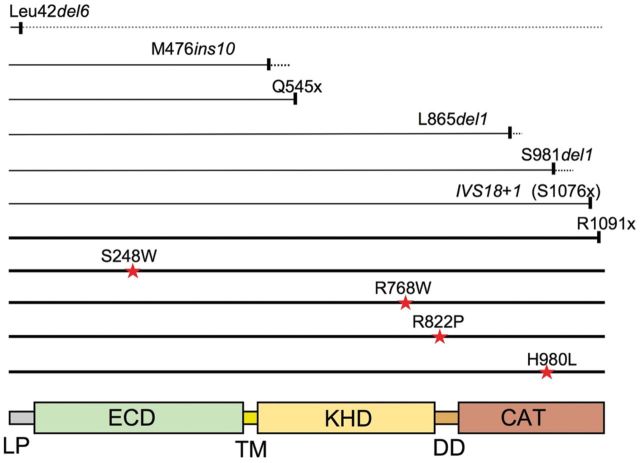
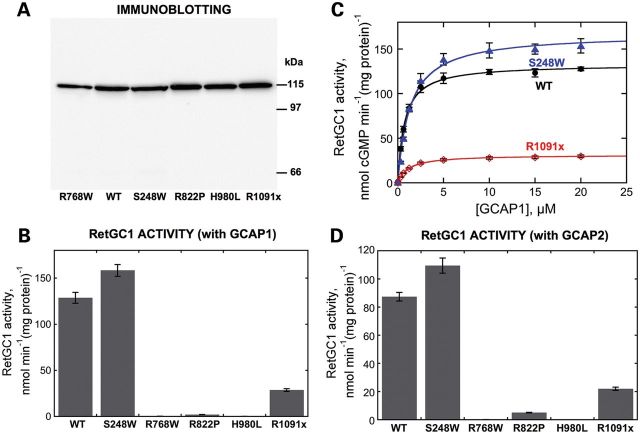
The GUCY2D gene encodes retinal membrane guanylyl cyclase (RetGC1), a key component of the phototransduction machinery in photoreceptors. Mutations in GUCY2D cause Leber congenital amaurosis type 1 (LCA1), an autosomal recessive human retinal blinding disease. The effects of RetGC1 deficiency on human rod and cone photoreceptor structure and function are currently unknown. To move LCA1 closer to clinical trials, we characterized a cohort of patients (ages 6 months-37 years) with GUCY2D mutations. In vivo analyses of retinal architecture indicated intact rod photoreceptors in all patients but abnormalities in foveal cones. By functional phenotype, there were patients with and those without detectable cone vision. Rod vision could be retained and did not correlate with the extent of cone vision or age. In patients without cone vision, rod vision functioned unsaturated under bright ambient illumination. In vitro analyses of the mutant alleles showed that in addition to the major truncation of the essential catalytic domain in RetGC1, some missense mutations in LCA1 patients result in a severe loss of function by inactivating its catalytic activity and/or ability to interact with the activator proteins, GCAPs. The differences in rod sensitivities among patients were not explained by the biochemical properties of the mutants. However, the RetGC1 mutant alleles with remaining biochemical activity in vitro were associated with retained cone vision in vivo. We postulate a relationship between the level of RetGC1 activity and the degree of cone vision abnormality, and argue for cone function being the efficacy outcome in clinical trials of gene augmentation therapy in LCA1.


Figures

Figure 1.
Figure 1.
Human GUCY2D-LCA retinas analyzed for in vivo evidence of photoreceptor structural disease. (A) En face images of autofluorescence in a normal subject (above; age 48) and 3 GUCY2D-LCA patients (below) show a spectrum from a near-normal appearance (P8) to grades of maculopathy (P7, P11). Arrows and labels indicate location of optic nerve head and fovea. (B) Cross-sectional optical coherence tomography (OCT) scans of retinal architecture along 9 mm of the horizontal meridian through the fovea of GUCY2D-LCA P7 and P11 (below) compared with a normal subject (above; age 23). ONL (outer photoreceptor nuclear layer) is labeled and highlighted (blue) on the scans. (C) The quantitation of ONL thickness in the OCT scans of all 11 GUCY2D-LCA patients (symbols connected by lines) superimposed on normal data (gray; n = 12, 8–48 years). (D) ONL thickness in all patients plotted as a fraction of a mean normal thickness to more clearly mark which regions of the scans are abnormal (reduced thickness, colored symbols; within normal limits, gray symbols). Dashed gray line, lower limit of normal (−2SD from mean). (E) The rod-to-cone photoreceptor ratio along the horizontal median [derived from Curcio et al. (41)]; dashed lines extend from the vertical axis at 10:1 and 20:1 rod:cone ratios. (F) Photoreceptor laminar architecture distal to the ONL in extrafoveal (2–7 mm temporal retina; turquoise rectangle) and foveal (central 1 mm; orange rectangle) retinal regions. Left column, extrafoveal scans in a normal subject (N, age 30) and GUCY2D-LCA patients (P8, P11); ONL (dark blue) and rod outer segments (ROS+, light blue) are highlighted. ROS+ thickness data from eight patients (symbols connected by lines) plotted on normal limits (light blue; mean ± 2SD). Middle column, foveal scans in a normal subject and in P7 and P9; ONL (dark blue) and cone outer segments (COS+, orange) are highlighted. COS+ thickness data from the same eight patients (symbols connected by lines) plotted on normal limits (orange; mean ± 2SD). F, fovea; T, temporal; N, nasal. Right column, magnified outer retina in fovea to illustrate abnormal laminar architecture in LCA1 patients (e.g. P4,P9) versus normal. Schematic of three cones (from OLM to the level of and including RPE) is superimposed on the normal scan. Arrows point to the layers representing OLM, outer limiting membrane; ISe, inner segment ellipsoid; COST, cone outer segment tips and RPE/BM, retinal pigment epithelium/Bruch's membrane.
Figure 2.
Figure 2.
GUCY2D-LCA patients can have substantial rod vision. (A) Rod-mediated full-field sensitivity test (FST) results in nine GUCY2D-LCA patients. Black bars are dark-adapted FST sensitivities to blue light in each patient (age and patient numbers noted below bars). Gray bar at left is average normal sensitivities (n = 9, ages 22–58) for dark-adapted blue (brackets, ±2SD). Scale divisions in log10 units (l.u.). (B) Full-field ERG responses to increasing intensities of achromatic light stimuli ranging from −3.24 to 1.0 log phot cd s m−2 in the dark-adapted state (top); light-adapted stimuli to 0.76 log phot cd s m−2 at 1 and 30 Hz (bottom). N, normal (age 37). Waveforms recorded for P3, P9, P4 and P7 are shown. Calibrations are at lower right of traces. (C) Rod (dark adapted, 500 nm) and cone (light-adapted, 600 nm) sensitivity maps on a 12° grid covering the visual field in three patients (P9, P11 and P8) compared with normal averages (left; for 500 nm, n = 16; for 600 nm n = 13; ages 13–55). Sensitivities are coded in levels of gray, using a range of 0–5 l.u. for rods and 0 to 2.5 l.u. for cones. N, nasal; T, temporal; S, superior; I, inferior visual field. Black square at 12° temporal field, physiological blind spot. (D) Mobility performance of six patients (P2,P3,P4,P9,P6,P10) as measured by the number of navigation incidents experienced while traveling an indoor course of fixed length, for five ambient illumination levels. Symbols are averages of at least three trials performed for each illumination level except for 100 lux, at which two runs were performed. Brackets indicate the range (minimum and maximum) of the number of incidents recorded in all trials available.
Figure 3.
Figure 3.
Adaptation of GUCY2D-LCA vision to ambient light conditions. Sensitivity to full-field chromatic stimuli is presented under dark-adapted (DA), or cone-plateau conditions or as increments on steady white background lights in normal subjects or in GUCY2D-LCA. (A) Patients with detectable rod and cone function (P3, P4, P7) compared with normal (n = 3, ages, 22–49). (B) Patients with only detectable rod function (P11, P2, P9, P6). Sensitivities to blue stimuli represented by blue symbols, and red stimuli with red symbols; spectral sensitivity functions of rod- and cone-based vision are used to segregate data into rod and cone panels. Thick gray lines are mathematical functions representing modified Weber-law behavior (see Supplementary Material, Fig. S2). Thinner black lines are the result of vertical and horizontal shifting of the normal function to fit the patient data. Error bars are 1SD but not always visible. DA, dark-adapted, data are collected under dark-adapted conditions for the rod panels, and cone-plateau conditions for the cone panels. The abscissa are in phot-Td units for cone panels and scot-Td units for the rod panels.
Figure 4.
Figure 4.
The effects of the LCA1 mutations on the primary structure of RetGC1. GUCY2D gene encodes a 1103 amino acid polypeptide, starting with the leader peptide (LP) and consisting of two major portions—the ‘extracellular’ domain (ECD) and the cytoplasmic portion containing a large kinase-homology domain (KHD) and a catalytic domain (CAT); TM, transmembrane region; DD, dimerization domain (57). The length of the solid horizontal line represents the size of the polypeptide relative to that of the wild-type RetGC1, predicted for each of the mutations found in our LCA1 cohort. The dashed lines indicate the region of out-of-frame sequence or aberrant processing of the protein. The positions of the mutations that prevent the synthesis of a normal-size polypeptide are shown as vertical bars. The positions of the missense mutations that do not affect the size of the RetGC1 polypeptide are shown by red asterisks. The bottom five mutants (thick horizontal lines) were produced in HEK293 cells and tested in this study. Further explanations are given in the text.
Figure 5.
Figure 5.
In vitro testing of enzymatic activity of RetGC1 mutants found in LCA1 patients. (A) Immunoblotting of wild-type RetGC1 and its mutants in HEK293 cells. Aliquots of the membrane fractions from the transfected HEK293 cells were probed with anti-RetGC1 antibodies and developed using chemiluminescence as described in Methods. Prior to the RetGC activity assays, the samples were equalized by the amount of RetGC1 with that of the wild-type using the relative chemiluminescence intensity in the band. (B) The activity of recombinant RetGC1 (nmol cGMP/min/mg protein) in the presence of 15 µM GCAP1 (mean ± SD, n): wild-type – 129 ± 6, 9; Ser248Trp—158 ± 6.4, 9; Arg768Trp—0.2 ± 0.07, 5; Arg822Pro—2 ± 0.1, 5; His980Leu—0.11 ± 0.05, 5; Arg1091x—28.6 ± 1.5, 9. (C) Dose-dependence of the cyclase activation by GCAP1: wild-type (filled circles), Ser248Trp (filled triangle), Arg1091x (open diamonds); the data were fitted using Michaelis hyperbolic function; error bars—SD. (D)The activity of recombinant RetGC1 (nmol cGMP/min/mg total membrane protein) in the presence of 15 µM GCAP2 (mean ± SD, n): wild-type—87.4 ± 3.1, 3; Ser248Trp–110 ± 5.4, 3; Arg768Trp—0.08 ± 0.04, 5; Arg822Pro—5.03 ± 0.22, 5; His980Leu – 0.005 ± 0.007, 3; Arg1091x—22 ± 1.2, 5. See Methods for other details.

Similar articles

Cited by

References

    1. Yau K.W., Hardie R.C. Phototransduction motifs and variations. Cell. 2009;139:246–264. - PMC - PubMed
    1. Ripps H. Light to sight: milestones in phototransduction. FASEB J. 2010;24:970–975. - PubMed
    1. Burns M.E., Pugh E.N., Jr Lessons from photoreceptors: turning off g-protein signaling in living cells. Physiology. 2010;25:72–84. - PMC - PubMed
    1. Arshavsky V.Y., Burns M.E. Photoreceptor signaling: supporting vision across a wide range of light intensities. J. Biol. Chem. 2012;287:1620–1626. - PMC - PubMed
    1. Bramall A.N., Wright A.F., Jacobson S.G., McInnes R.R. The genomic, biochemical, and cellular responses of the retina in inherited photoreceptor degenerations and prospects for the treatment of these disorders. Annu. Rev. Neurosci. 2010;33:441–472. - PubMed

Publication types

MeSH terms