

The limits of mean-field heterozygosity estimates under spatial extension in simulated plant populations
- PMID: 22952655
- PMCID: PMC3428328
- DOI: 10.1371/journal.pone.0043254
The limits of mean-field heterozygosity estimates under spatial extension in simulated plant populations
Abstract
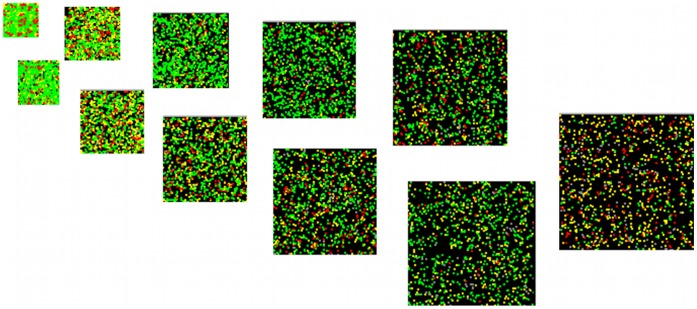
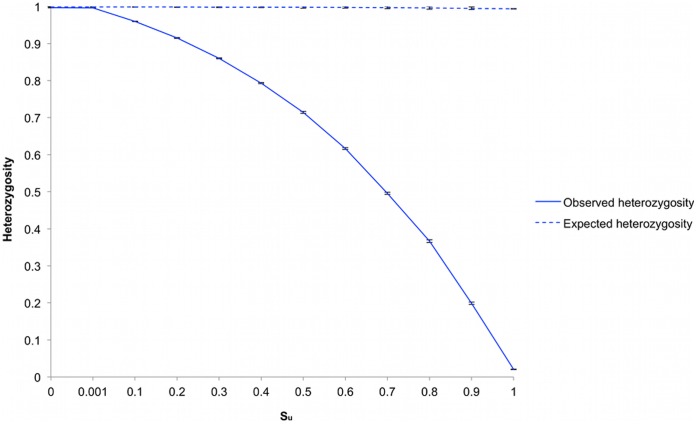
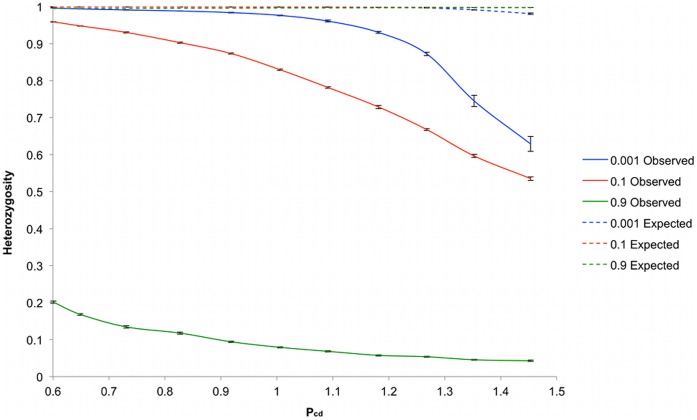
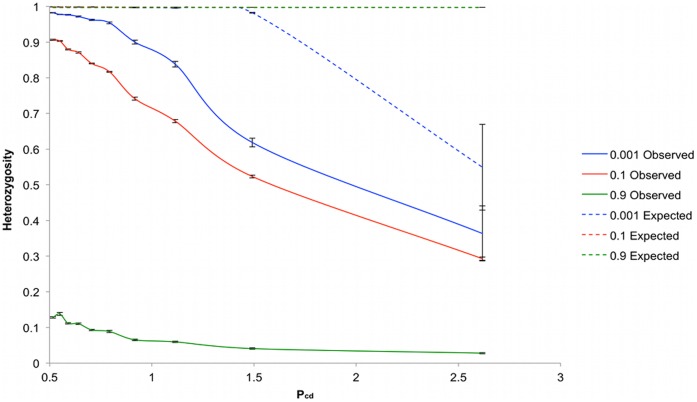
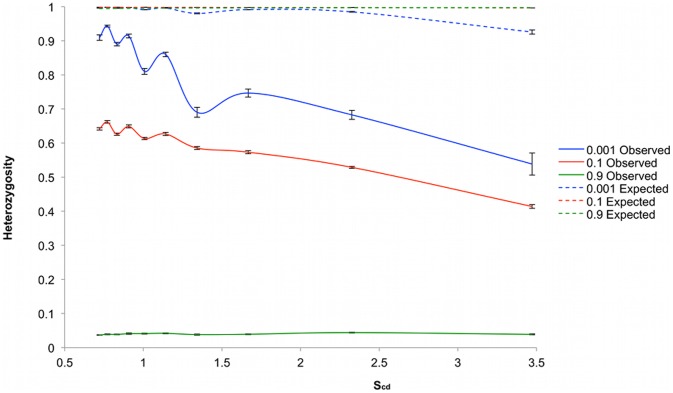
Computational models of evolutionary processes are increasingly required to incorporate multiple and diverse sources of data. A popular feature to include in population genetics models is spatial extension, which reflects more accurately natural populations than does a mean field approach. However, such models necessarily violate the mean field assumptions of classical population genetics, as do natural populations in the real world. Recently, it has been questioned whether classical approaches are truly applicable to the real world. Individual based models (IBM) are a powerful and versatile approach to achieve integration in models. In this study an IBM was used to examine how populations of plants deviate from classical expectations under spatial extension. Populations of plants that used three different mating strategies were placed in a range of arena sizes giving crowded to sparse occupation densities. Using a measure of population density, the pollen communication distance (P(cd)), the deviation exhibited by outbreeding populations differed from classical mean field expectations by less than 5% when P(cd) was less than 1, and over this threshold value the deviation significantly increased. Populations with an intermediate mating strategy did not have such a threshold and deviated directly with increasing isolation between individuals. Populations with a selfing strategy were influenced more by the mating strategy than by increased isolation. In all cases pollen dispersal was more influential than seed dispersal. The IBM model showed that mean field calculations can be reasonably applied to natural outbreeding plant populations that occur at a density in which individuals are less than the average pollen dispersal distance from their neighbors.
Conflict of interest statement
Figures
Similar articles
-
Fine-scale spatial genetic structure with nonuniform distribution of individuals.Genetics. 1998 Feb;148(2):905-19. doi: 10.1093/genetics/148.2.905. Genetics. 1998. PMID: 9504936 Free PMC article.
-
Antagonism between local dispersal and self-incompatibility systems in a continuous plant population.Mol Ecol. 2009 Jun;18(11):2327-36. doi: 10.1111/j.1365-294X.2009.04180.x. Epub 2009 Apr 23. Mol Ecol. 2009. PMID: 19389171 Free PMC article.
-
Mating system and the critical migration rate for swamping selection.Genet Res (Camb). 2011 Jun;93(3):233-54. doi: 10.1017/S0016672311000127. Epub 2011 May 6. Genet Res (Camb). 2011. PMID: 21554777
-
Self-incompatibility systems: barriers to self-fertilization in flowering plants.Int J Dev Biol. 2008;52(5-6):627-36. doi: 10.1387/ijdb.072537ar. Int J Dev Biol. 2008. PMID: 18649276 Review.
-
Pollen and seed dispersal among dispersed plants.Biol Rev Camb Philos Soc. 2005 Aug;80(3):413-43. doi: 10.1017/s1464793105006731. Biol Rev Camb Philos Soc. 2005. PMID: 16094807 Review.
Cited by
-
Systems Modeling at Multiple Levels of Regulation: Linking Systems and Genetic Networks to Spatially Explicit Plant Populations.Plants (Basel). 2013 Jan 25;2(1):16-49. doi: 10.3390/plants2010016. Plants (Basel). 2013. PMID: 27137364 Free PMC article. Review.
-
Storytelling and story testing in domestication.Proc Natl Acad Sci U S A. 2014 Apr 29;111(17):6159-64. doi: 10.1073/pnas.1400425111. Epub 2014 Apr 21. Proc Natl Acad Sci U S A. 2014. PMID: 24753572 Free PMC article.
References
-
- Allaby RG (2010) Integrating the processes in the evolutionary system of domestication. Journal of Experimental Botany 61: 935–944. - PubMed
-
- Hardy GH (1908) Mendelian proportions in a mixed population. Science 28 (706): 49–50. - PubMed
-
- Mayr E (1978) Review of Modes of Speciation by MJD White. Syst. Zool. 27: 478–482.
Publication types
MeSH terms
Grants and funding
LinkOut - more resources
Full Text Sources
