. 2012 Apr 1;590(7):1599-614.
doi: 10.1113/jphysiol.2012.228205. Epub 2012 Jan 30.

Altered Kv3.3 channel gating in early-onset spinocerebellar ataxia type 13

Affiliations

Altered Kv3.3 channel gating in early-onset spinocerebellar ataxia type 13

Natali A Minassian et al. J Physiol. .

Abstract

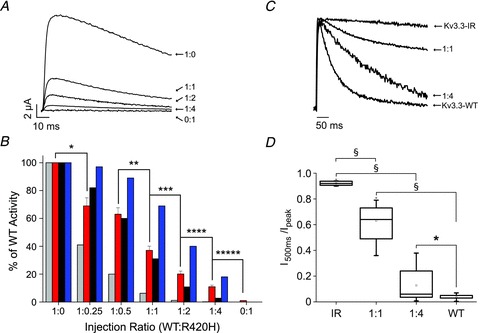
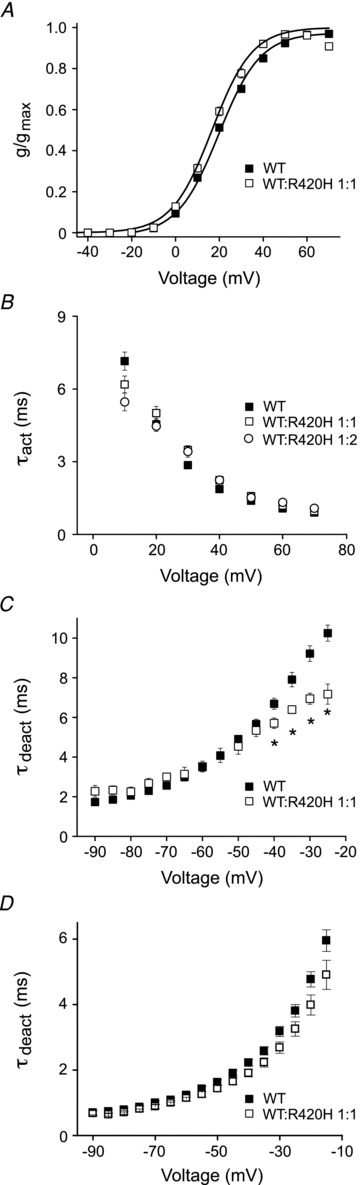
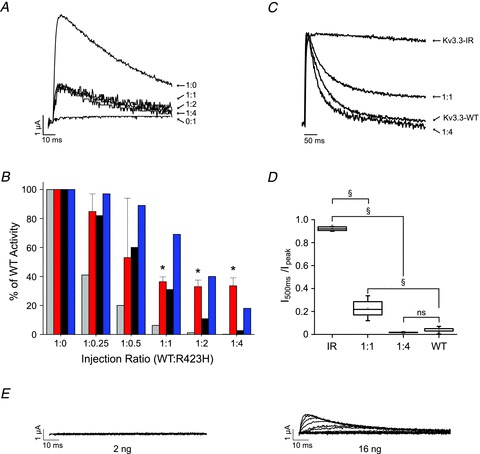
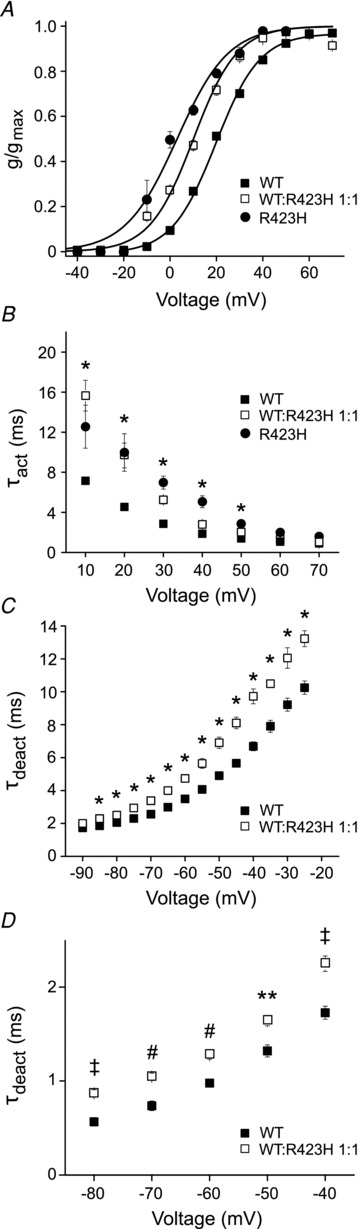
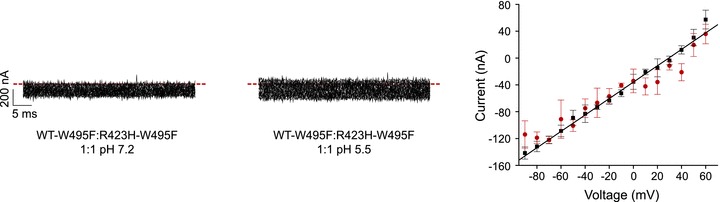
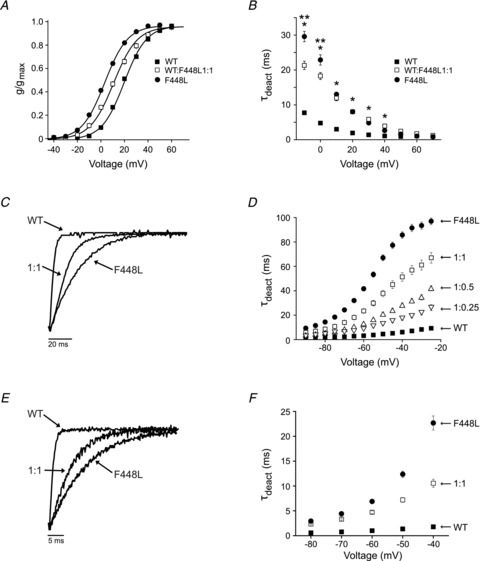
Mutations in Kv3.3 cause spinocerebellar ataxia type 13 (SCA13). Depending on the causative mutation, SCA13 is either a neurodevelopmental disorder that is evident in infancy or a progressive neurodegenerative disease that emerges during adulthood. Previous studies did not clarify the relationship between these distinct clinical phenotypes and the effects of SCA13 mutations on Kv3.3 function. The F448L mutation alters channel gating and causes early-onset SCA13. R420H and R423H suppress Kv3 current amplitude by a dominant negative mechanism. However, R420H results in the adult form of the disease whereas R423H produces the early-onset, neurodevelopmental form with significant clinical overlap with F448L. Since individuals with SCA13 have one wild type and one mutant allele of the Kv3.3 gene, we analysed the properties of tetrameric channels formed by mixtures of wild type and mutant subunits. We report that one R420H subunit and at least one R423H subunit can co-assemble with the wild type protein to form active channels. The functional properties of channels containing R420H and wild type subunits strongly resemble those of wild type alone. In contrast, channels containing R423H and wild type subunits show significantly altered gating, including a hyperpolarized shift in the voltage dependence of activation, slower activation, and modestly slower deactivation. Notably, these effects resemble the modified gating seen in channels containing a mixture of F448L and wild type subunits, although the F448L subunit slows deactivation more dramatically than the R423H subunit. Our results suggest that the clinical severity of R423H reflects its dual dominant negative and dominant gain of function effects. However, as shown by R420H, reducing current amplitude without altering gating does not result in infant onset disease. Therefore, our data strongly suggest that changes in Kv3.3 gating contribute significantly to an early age of onset in SCA13.


Figures

Figure 1
Figure 1. One R420H subunit can incorporate into functional Kv3.3 channels
A, RNA encoding wild type and R420H subunits was injected into oocytes at the indicated ratios (WT:R420H). Currents were evoked by pulsing from −90 mV to +40 mV. Representative examples are shown. B, bar graph shows normalized peak current amplitudes measured at +40 mV for the indicated ratios of wild type and R420H RNA (2nd bar from left at each ratio). Values are provided as mean ± SEM, n = 19–45. Significance was tested using a one-way ANOVA followed by 2 sample t test, P < 0.05: *different from 1:0; **different from 1:0.5; ***different from 1:1; ****different from 1:2; *****different from 1:4. Also shown are the predictions of the binomial distribution for the hypotheses that one mutant subunit abolishes activity (1st bar) or that one (3rd bar) or two (4th bar) mutant subunits can incorporate into functional channels. The graph differs somewhat from published data because the amount of wild type RNA used in previous experiments was sometimes beyond the linear response range (Waters et al. 2006). C, Kv3.3-IR and R420H subunits were expressed at the indicated ratios (IR:R420H) or Kv3.3-IR and wild type were expressed alone. Current traces were evoked by pulsing from −80 mV to +40 mV. Representative examples, scaled to the same amplitude and overlaid, are shown. D, box plot shows normalized I500ms/Ipeak values measured at +40 mV for the indicated ratios of Kv3.3-IR and R420H subunits. For comparison, values obtained with Kv3.3-IR or wild type expressed alone are also shown. Indicated pairs differed significantly by one-way ANOVA followed by 2 sample t test: §P < 0.00001; *P < 0.05 (Kv3.3-IR, n = 21; 1:1, n = 18; 1:4, n = 13; wild type, n = 15).
Figure 2
Figure 2. R420H subunits have little effect on the functional properties of Kv3.3 channels
A, normalized conductance has been plotted as a function of voltage for wild type Kv3.3 expressed alone (▪, n = 155) or with R420H at a 1:1 ratio (□, n = 29). Values are provided as mean ± SEM. Here and in subsequent figures, if error bars are not visible they are smaller than the size of the symbol. Data sets were fitted with single Boltzmann functions (continuous lines). Midpoint voltages and slope factors are shown in Table 1. Results obtained at ratios of 1:2 and 1:4 did not differ significantly from 1:1 (data not shown). B, currents were evoked by pulsing from –90 mV to voltages ranging from +10 to +70 mV in 10 mV increments. Current traces were fitted with a single exponential function to estimate the time constant for activation (τact), which has been plotted versus voltage. Data are shown for wild type expressed alone (▪, n = 48) or co-injected with R420H at ratios of 1:1 (□, n = 9) and 1:2 (o, n = 9). Values are provided as mean ± SEM. Values of τact did not differ significantly (one-way ANOVA followed by 2 sample t test, P≥ 0.05). C, tail currents were recorded in a high Rb+ bath solution by repolarizing from +40 mV to voltages ranging from 25 to –90 mV in 5 mV increments. Traces were fitted with a single exponential function to estimate the time constant for deactivation (τdeact), which has been plotted versus repolarization voltage. Data are shown for wild type expressed alone (▪, n = 36) or with R420H at a 1:1 ratio (□, n = 11). Values are provided as mean ± SEM. Between –25 and –40 mV, values of τdeact differed significantly by ANOVA followed by 2 sample t test (*P < 0.05). At ratios of 1:2 and 1:4, tail currents were too small to measure. D, tail currents were recorded in a high K+ bath solution by repolarizing from +40 mV to voltages ranging from 15 to 90 mV in 5 mV increments. Traces were fitted with a single exponential function to estimate τdeact, which has been plotted versus repolarization voltage. Data are shown for wild type expressed alone (▪, n = 9) or with R420H at a 1:1 ratio (□, n = 11). Values are provided as mean ± SEM. Values of τdeact did not differ significantly by ANOVA followed by 2 sample t test (P≥ 0.05).
Figure 3
Figure 3. R420H mutation does not generate detectable gating pore currents in oocytes
Data are shown for: A, WT:W495F expressed alone; B, WT:W495F and R420H:W495F expressed at a 1:1 ratio; C, uninjected oocytes; and D, oocytes injected with RNase-free water (mock-injected). Each panel shows representative, unsubtracted current traces recorded at pH 7.2 (left) or 5.5 (centre) by pulsing from –90 mV to voltages ranging from −90 to +60 mV in 10 mV increments. Dashed lines indicate the 0 current level. Right: current amplitudes measured at pH 7.2 (squares) or 5.5 (circles) have been plotted versus voltage. Values are provided as mean ± SEM. The continuous line shows a linear regression fit to the pH 7.2 data.
Figure 4
Figure 4. At least one R423H subunit can incorporate into functional Kv3.3 channels
A, RNA encoding wild type and R423H subunits was injected into oocytes at the indicated ratios (WT:R423H). Currents were evoked by pulsing from −90 mV to +40 mV. Representative examples are shown. B, bar graph shows normalized peak current amplitudes measured at +40 mV for the indicated ratios of wild type and R423H (2nd bar from left at each ratio). Values are provided as mean ± SEM, n = 3–32. Indicated values differed significantly from wild type expressed alone by one-way ANOVA followed by 2 sample t test (*P < 0.05). Also shown are the predictions of the binomial distribution for the hypotheses that one mutant subunit abolishes activity (1st bar) or that one (3rd bar) or two (4th bar) mutant subunits can incorporate into functional channels. The graph differs somewhat from published data because the amount of wild type RNA used in previous experiments was sometimes beyond the linear response range (Figueroa et al. 2010). C, Kv3.3-IR and R423H subunits were expressed at the indicated ratios (IR:R423H) or Kv3.3-IR and wild type were expressed alone. Current traces were evoked by pulsing from −80 mV to +40 mV. Representative examples, scaled to the same amplitude and overlaid, are shown. D, box plot shows normalized I500ms/Ipeak values measured at +40 mV for the indicated ratios of Kv3.3-IR and R423H subunits. For comparison, values obtained with Kv3.3-IR or wild type expressed alone are also shown. Indicated pairs differed significantly by one-way ANOVA followed by 2 sample t test: §P < 0.00001; ns, not significant (Kv3.3-IR, n = 21; 1:1, n = 10; 1:4, n = 5; wild type, n = 15). E, RNA encoding R423H (2 ng or 16 ng, as indicated) was injected into oocytes. Traces were recorded by stepping from –90 mV to voltages ranging from 80 to +70 mV in 10 mV increments. Representative results are shown.
Figure 5
Figure 5. R423H subunits affect the specialized gating properties of Kv3.3 channels
A, normalized conductance has been plotted as a function of voltage for wild type Kv3.3 (▪, n = 155) or R423H (•, n = 4) expressed alone or for wild type and R423H expressed at a 1:1 ratio (□, n = 35). Values are provided as mean ± SEM. Data sets were fitted with single Boltzmann functions (continuous lines). Midpoint voltages and slope factors are shown in Table 1. B, current traces were fitted with a single exponential function to estimate τact, which has been plotted versus voltage. Data are shown for wild type (▪, n = 48) or R423H (•, n = 4) expressed alone and for wild type and R423H expressed at a 1:1 ratio (□, n = 7). Values are provided as mean ± SEM. As indicated, R423H expressed alone or in a 1:1 ratio with wild type differed significantly from wild type expressed alone by one-way ANOVA followed by 2 sample t test (*P < 0.05). C, tail currents were recorded in a high Rb+ bath solution by repolarizing from +40 mV to voltages ranging from 25 to –90 mV. Traces were fitted with a single exponential function to estimate τdeact, which has been plotted versus repolarization voltage. Data are shown for wild type expressed alone (▪, n = 36) or with R423H at a 1:1 ratio (□, n = 4). Values are provided as mean ± SEM. Values of τdeact differed significantly by ANOVA followed by 2 sample t test (*P < 0.05). When R423H was expressed alone, tail currents were too small to measure. D, tail currents were recorded in a high K+ bath solution by repolarizing from +40 mV to voltages ranging from 40 to –80 mV in 10 mV increments. Traces were fitted with a single exponential function to estimate τdeact, which has been plotted versus repolarization voltage. Data are shown for wild type expressed alone (▪, n = 8–11) or with R423H at a 1:1 ratio (□, n = 19). Values are provided as mean ± SEM. Values of τdeact differed significantly by ANOVA followed by 2 sample t test (#P < 0.0001; ‡P < 0.0005; **P < 0.001).
Figure 6
Figure 6. R423H mutation does not generate detectable gating pore currents in oocytes
WT-W495F and R423H-W495H subunits were expressed at a 1:1 ratio. Shown are representative, unsubtracted current traces recorded at pH 7.2 (left) or 5.5 (centre) by pulsing from –90 mV to voltages ranging from 90 to +60 mV in 10 mV increments. Dashed lines indicate the 0 current level. Right: current amplitudes measured at pH 7.2 (squares) or 5.5 (circles) have been plotted versus voltage. Values are provided as mean ± SEM. The continuous line shows a linear regression fit to the pH 7.2 data.
Figure 7
Figure 7. F448L and R423H subunits have similar effects on Kv3.3 channel gating
A, normalized conductance has been plotted as a function of voltage for wild type Kv3.3 (▪, n = 218) or F448L (•, n = 74) expressed alone and for wild type and F448L expressed at a 1:1 ratio (□, n = 49). Values are provided as mean ± SEM. Data sets were fitted with single Boltzmann functions (continuous lines). Midpoint voltages and slope factors are shown in Table 1. B, current traces were fitted with a single exponential function to estimate τact, which has been plotted versus voltage. Data are shown for wild type (▪) or F448L (•) expressed alone and for wild type and F448L expressed at a 1:1 ratio (□). Values are provided as mean ± SEM (n≥ 25) and differed significantly by one-way ANOVA followed by 2 sample t test, P < 0.05 (*F448L alone and 1:1 ratio differ from wild type; **1:1 differs from F448L alone). C, tail currents were recorded in a high Rb+ bath solution by pulsing from 90 to +40 mV prior to repolarizing to –65 mV for wild type or F448L expressed alone or for wild type expressed at a 1:1 ratio with F448L as indicated. Representative results are shown. D, tail currents were evoked in high Rb+ by repolarizing from +40 mV to voltages ranging from 25 to –90 mV. Tail current traces were fitted with a single exponential function to estimate τdeact, which has been plotted versus repolarization voltage for wild type (▪) or F448L (•) expressed alone and for wild type and F448L expressed at ratios of 1:0.25 (▿), 1:0.5 (▵) and 1:1 (□). Values are provided as mean ± SEM, n ≥ 25. All τdeact values differed significantly from wild type expressed alone, P < 0.05 by Student's t test, except for the 1:0.25 ratio measured at –90 mV. E, tail currents were recorded in a high K+ bath solution by pulsing from 90 to +40 mV prior to repolarizing to –50 mV for wild type or F448L expressed alone or for wild type expressed at a 1:1 ratio with F448L as indicated. Note change in scale compared to panel C. Representative results are shown. F, tail currents were evoked in high K+ by repolarizing from +40 mV to voltages ranging from 40 to –80 mV in 10 mV increments. Tail current traces were fitted with a single exponential function to estimate τdeact, which has been plotted versus repolarization voltage for wild type (▪) or F448L (•) expressed alone and for wild type and F448L expressed at a 1:1 ratio (□). Values are provided as mean ± SEM, n≥ 9. All τdeact values differed significantly from wild type expressed alone, P < 0.00001 by one-way ANOVA followed by 2 sample t test.

Similar articles

Cited by

References

    1. Baukrowitz T, Yellen G. Modulation of K+ current by frequency and external [K+]: a tale of two inactivation mechanisms. Neuron. 1995;15:951–960. - PubMed
    1. Blaine JT, Ribera AB. Heteromultimeric potassium channels formed by members of the Kv2 subfamily. J Neurosci. 1998;18:9585–9593. - PMC - PubMed
    1. Cannon SC. Voltage-sensor mutations in channelopathies of skeletal muscle. J Physiol. 2010;588:1887–1895. - PMC - PubMed
    1. Catterall WA. Ion channel voltage sensors: structure, function, and pathophysiology. Neuron. 2010;67:915–928. - PMC - PubMed
    1. Desai R, Kronengold J, Mei J, Forman SA, Kaczmarek LK. Protein kinase C modulates inactivation of Kv3.3 channels. J Biol Chem. 2008;283:22283–22294. - PMC - PubMed

Publication types

Supplementary concepts

LinkOut - more resources