. 2012 Jan 29;15(3):389-98, S1-2.
doi: 10.1038/nn.3040.

Selective control of inhibitory synapse development by Slitrk3-PTPδ trans-synaptic interaction

Affiliations

Selective control of inhibitory synapse development by Slitrk3-PTPδ trans-synaptic interaction

Hideto Takahashi et al. Nat Neurosci. .

Abstract

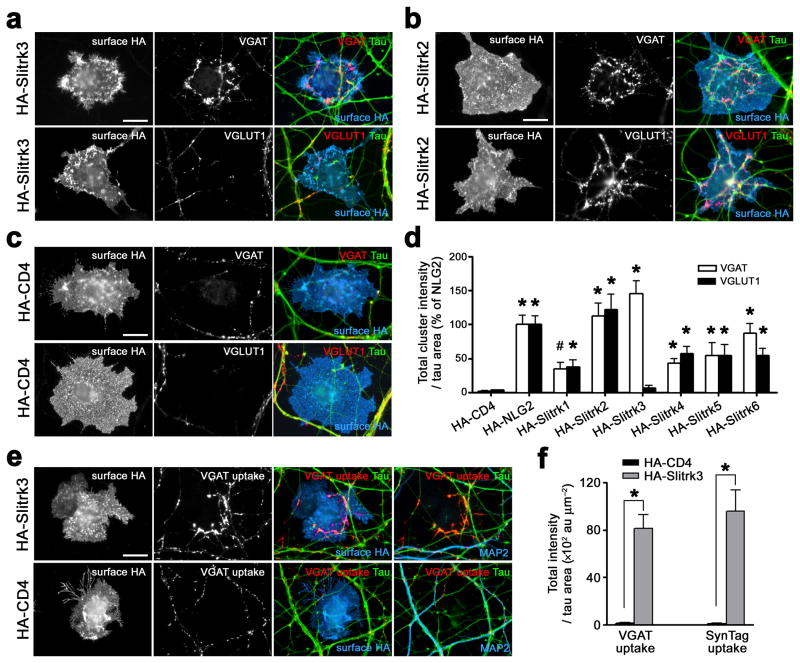
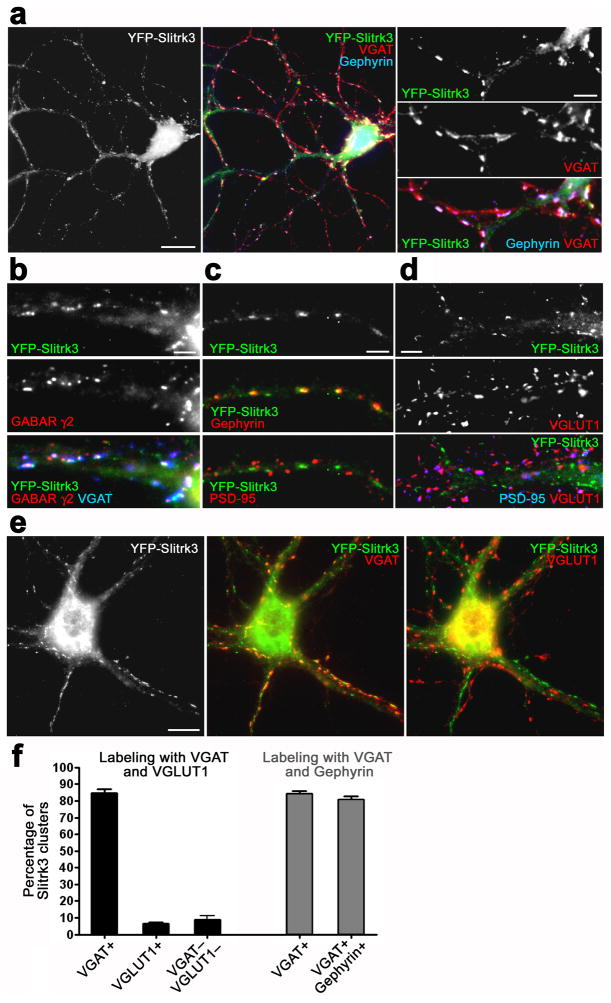
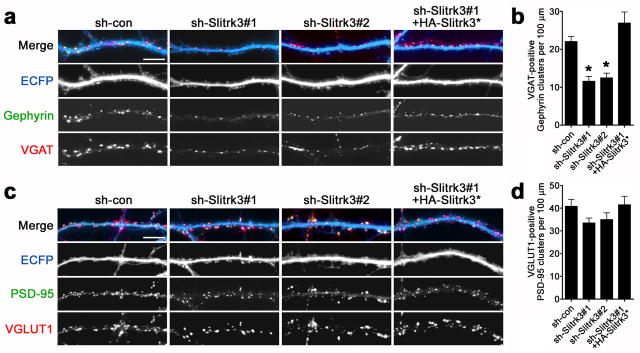
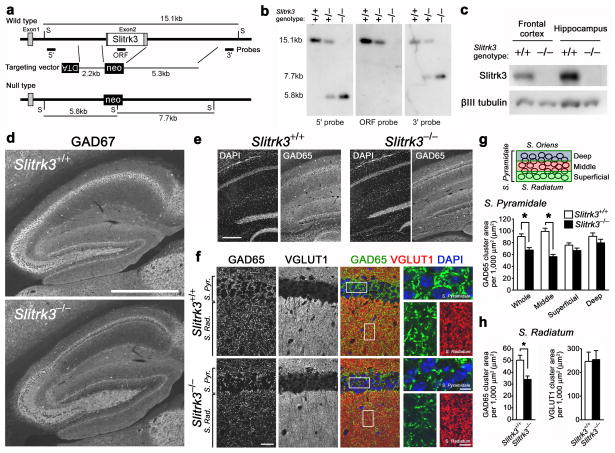
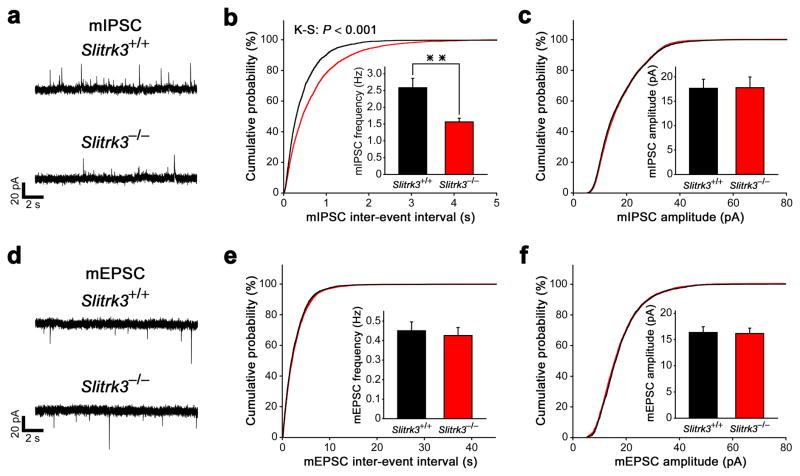
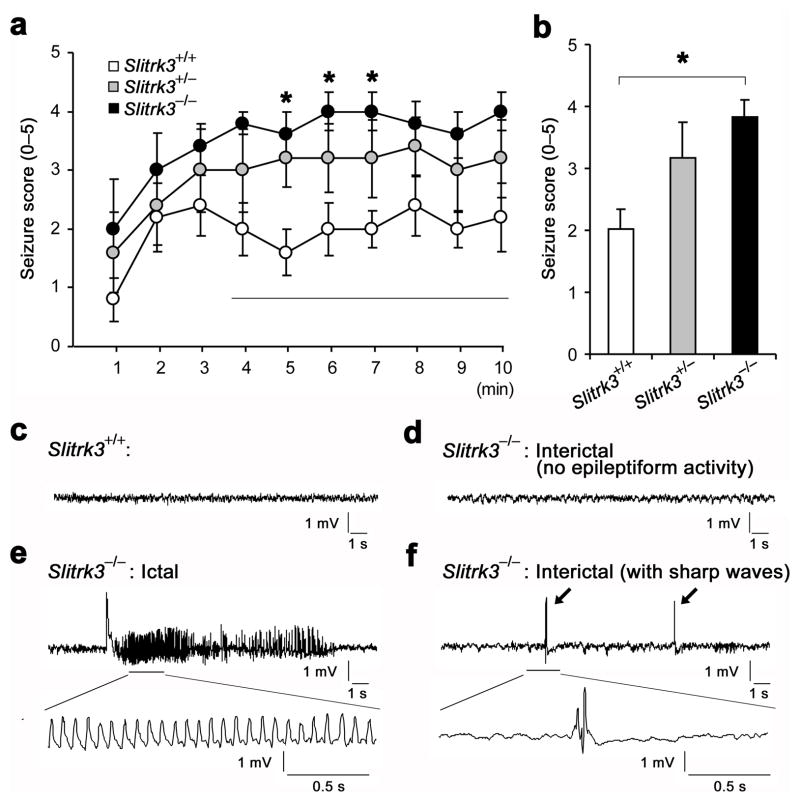
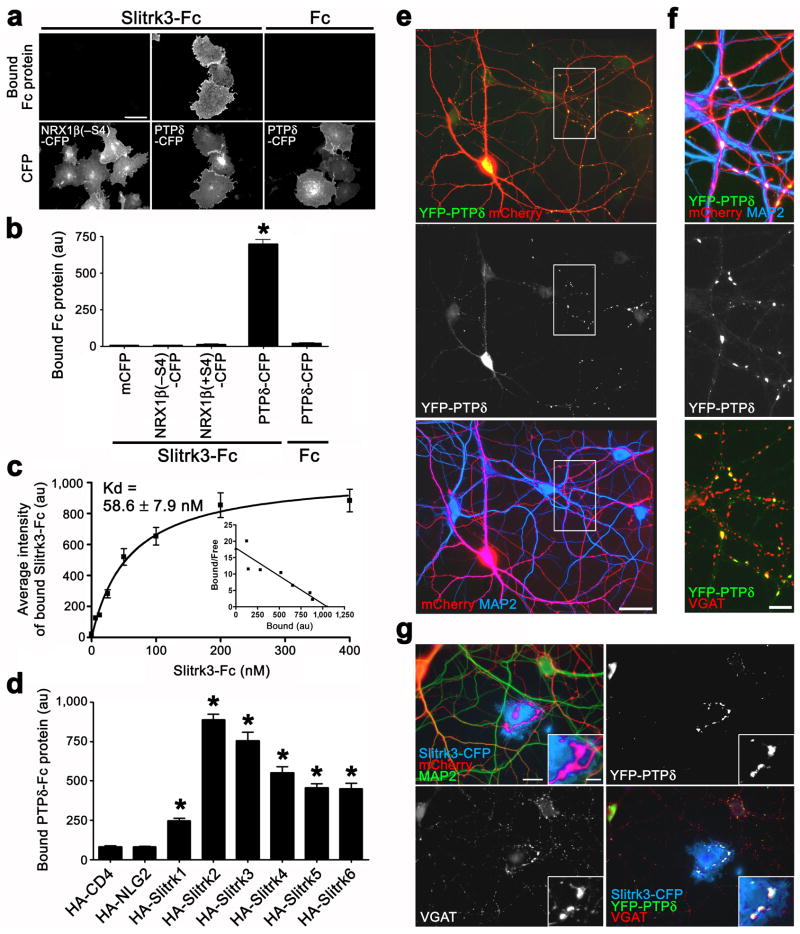
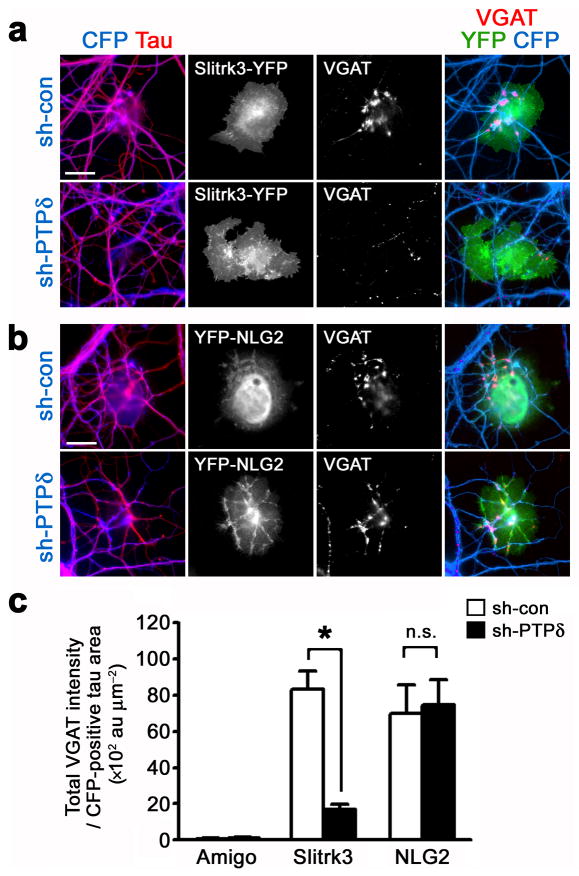
Balanced development of excitatory and inhibitory synapses is required for normal brain function, and an imbalance in this development may underlie the pathogenesis of many neuropsychiatric disorders. Compared with the many identified trans-synaptic adhesion complexes that organize excitatory synapses, little is known about the organizers that are specific for inhibitory synapses. We found that Slit and NTRK-like family member 3 (Slitrk3) actS as a postsynaptic adhesion molecule that selectively regulates inhibitory synapse development via trans-interaction with axonal tyrosine phosphatase receptor PTPδ. When expressed in fibroblasts, Slitrk3 triggered only inhibitory presynaptic differentiation in contacting axons of co-cultured rat hippocampal neurons. Recombinant Slitrk3 preferentially localized to inhibitory postsynaptic sites. Slitrk3-deficient mice exhibited decreases in inhibitory, but not excitatory, synapse number and function in hippocampal CA1 neurons and exhibited increased seizure susceptibility and spontaneous epileptiform activity. Slitrk3 required trans-interaction with axonal PTPδ to induce inhibitory presynaptic differentiation. These results identify Slitrk3-PTPδ as an inhibitory-specific trans-synaptic organizing complex that is required for normal functional GABAergic synapse development.


Figures

Figure 1
Figure 1. Slitrk3 selectively induces functional inhibitory presynaptic differentiation in coculture
(a) COS cells expressing HA-Slitrk3 induce clustering of VGAT but not VGLUT1 along contacting axons (labeled with dephosphorylated tau) in hippocampal neuron co-culture. (b) COS cells expressing HA-Slitrk2 induce both VGAT and VGLUT1 clustering. (c) COS cells expressing HA-CD4, a negative control, do not induce either VGAT or VGLUT1 clustering. (d) Total integrated intensity of VGAT or VGLUT1 associated with COS cells expressing the indicated HA-tagged proteins and not associated with MAP2 (images not shown) divided by the tau-positive axon contact area, expressed as a percentage of the value for HA-neuroligin2 (HA-NLG2). Kruskal-Wallis ANOVA, P< 0.0001, n ≥ 30 cells each; *P< 0.001, #P< 0.01 compared with HA-CD4 by post-hoc Dunn’s pair-wise multiple comparison test. Only HA-Slitrk3 selectively induces inhibitory presynaptic differentiation, whereas the other HA-Slitrks induce both excitatory and inhibitory presynaptic differentiation. (e,f) COS cells expressing HA-Slitrk3 but not HA-CD4 induce functional inhibitory presynaptic differentiation assessed by incubating live neurons with antibodies to VGAT luminal domainor antibodies to synaptotagmin I (SynTag) luminal domain. Mann-Whitney’s U test, *P< 0.0001, n = 30 cells each. Data are presented as mean ± s.e.m. Scale bars represent 20 μm.
Figure 2
Figure 2. Recombinant Slitrk3 localizes to inhibitory postsynaptic sites
(a, b) Recombinant YFP-Slitrk3 expressed at low level in cultured hippocampal neurons at 15 DIV is concentrated in dendrites at GABA synapses labeled with gephyrin apposed to VGAT (a) or labeled with GABA receptor γ2 apposed to VGAT (b). (c, d) YFP-Slitrk3 clusters are colocalized with gephyrin at GABA synapses (c, middle), but are not detected with PSD-95 (c, bottom) or with PSD-95 apposed to VGLUT1 at glutamate synapses (d). (e) Double immunolabeling of YFP-Slitrk3-expressing neurons with VGAT and VGLUT1. (f) Quantification of the percentage of YFP-Slitrk3 clusters apposed to VGAT clusters or to VGLUT1 clusters or not associated with either VGAT or VGLUT1 clusters, based on double labeling with VGAT and VGLUT1 (black bars, Kruskal-Wallis ANOVA, P< 0.0001, n = 30 cells). Gray bars indicate the percentage of YFP-Slitrk3 clusters apposed to VGAT or colocalized with gephyrin apposed to VGAT, based on double labeling with VGAT and gephyrin (n = 30 cells). Data are presented as mean ± s.e.m. Scale bars represent 20μm (a, left) 10 μm (e), 5 μm (a, right and d) and 3μm (b, c).
Figure 3
Figure 3. Slitrk3 knockdown decreases the density of inhibitory synapses in hippocampal culture
Cultured hippocampal neurons were transfected at 9–10 DIV with a vector co-expressing ECFP and either control shRNA (sh-con) or independent shRNA sequences effective to knock down Slitrk3 (sh-Slitrk3#1 and sh-Slitrk3#2). Neurons were analyzed at 15–16 DIV. Slitrk3 knockdown reduced the clusters of apposed gephyrin/VGAT marking inhibitory synapses (a,b) but had no effect on apposed PSD-95/VGLUT1 marking excitatory synapses (c,d). Co-expression of RNAi-resistant HA-Slitrk3 (HA-Slitrk3*) completely rescued the effects of Slitrk3 knockdown on inhibitory synapse markers. Kruskal-Wallis ANOVA, P< 0.0001 for VGAT-positive gephyrin and P = 0.18 for VGLUT1-positive PSD95, n> 30 cells each except sh-Slitrk3#1+HA-Slitrk3* n = 20, *P< 0.001 compared with sh-con by Dunn’s pairwise post-hoc test. Data are presented as mean ± s.e.m. Scale bars represent 10 μm.
Figure 4
Figure 4. Slitrk3−/− mice have reduced inhibitory synapse density in CA1 region of hippocampus
(a, b) Strategy for targeted deletion of Slitrk3, and confirmation of homologous recombination by Southern blot. The entire protein-coding region (white box) in exon 2 was replaced with the PGK-neo (neo) cassette. DTA, diphtheria toxin-A cassette; gray boxes, untranslated exon regions; S, ScaI site. (c) Western blot of the frontal cortex and hippocampus of adult Slitrk3+/+ and Slitrk3−/−mice. (d,e) Immunofluorescence for inhibitory presynaptic markers GAD67 in sagittal sections (d) and GAD65 in coronal sections (e; DAPI for nuclei) from wild-type (Slitrk3+/+) and Slitrk3−/− mice. Note a marked decrease in GAD67 and GAD65 immunoreactivities in the middle layer of CA1 stratum pyramidale in Slitrk3−/− mice. (f) High magnification images from wild-type and Slitrk3−/− mice immunolabed for GAD65 and VGLUT1 with DAPI staining. (g) For measurement, stratum pyramidale was divided into three approximately equal sub-layers based on DAPI images. Total area of clustered GAD65 was decreased in stratum pyramidale of Slitrk3−/− mice, selectively in its middle layer. Kruskal-Wallis ANOVA, P< 0.0001, *P< 0.001 compared with wild-type by Dunn’s pairwise post-hoc test, wild-type: n = 59 images from 4 mice, Slitrk3−/−: n = 83 images from 5 mice. (h) Total area of GAD65 clusters, but not VGLUT1 clusters, was decreased in stratum radiatum of Slitrk3−/− mice. Mann-Whitney’s U test, *P< 0.001 for GAD65 and P = 0.38 for VGLUT1, n as in (g). Data are presented as mean ± s.e.m. Scale bars represent 500 μm (d), 200 μm (e), 20 μm (f, left) and 5 μm (f, right).
Figure 5
Figure 5. Slitrk3−/− mice have reduced inhibitory synaptic transmission in CA1 of the hippocampus
(a) Representative recordings of mIPSCs from wild-type (Slitrk3+/+) and Slitrk3−/−hippocampal CA1 pyramidal neurons. (b, c) Cumulative distributions of mIPSC inter-event intervals (b) and amplitudes (c) in wild-type and Slitrk3−/− neurons. Insets in (b) and (c) display the mean ± s.e.m. frequency and amplitude, respectively. Kolmogorov-Smirnov (K-S) test: P< 0.001 for frequency and P = 0.11 for amplitude, Mann-Whitney’s U test: **P< 0.001 for frequency and P = 0.75 for amplitude, n = 11 neurons from five mice for wild-type and n = 13 neurons from four mice for Slitrk3−/−. (d) Representative recordings of mEPSCs from wild-type and Slitrk3−/− hippocampal CA1 pyramidal neurons. (e, f) Cumulative distributions of mEPSC inter-event intervals (e) and amplitudes (f) in wild-type and Slitrk3−/− neurons. Insets in (e) and (f) display the mean ± s.e.m. frequency and amplitude, respectively. Kolmogorov-Smirnov test: P = 0.09 for frequency and P = 0.25 for amplitude, Mann-Whitney’s U test: P = 0.62 for frequency and P = 0.78 for amplitude, n = 10 neurons from four mice for wild-type and n = 11 neurons from five mice for Slitrk3−/−.
Figure 6
Figure 6. Slitrk3−/− mice exhibit increased seizure susceptibility and abnormal epileptiform activities in EEG recording
(a) Time course of mean scores of seizures induced by intraperitoneal injection of pentylenetetrazole (PTZ, 50 mg/kg) into Slitrk3+/+, Slitrk3+//−, and Slitrk3−/− mice (n = 5 each genotype). Seizures were scored at every 1 min for 10 min according to the following criteria: no abnormal behavior (0), reduced motility and prostate position (1), partial clonus (2), generalized clonus including extremities (3), tonic-clonic seizure with rigid paw extension (4), and death (5). Kruskal-Wallis ANOVA P < 0.05, *P< 0.05 compared with wild-type by Dunn’s pairwise post-hoc test. (b) Quantification of mean score values for 4–10 min in each genotype. Kruskal-Wallis ANOVA, P = 0.021, *P< 0.05 compared with wild-type by Dunn’s pairwise post-hoc test, n = 5 each genotype. (c–f) Representative EEG recordings under drug-free conditions from a wild-type littermate (c), from Slitrk3−/− miceduring an interictal period without epileptiform activity (d), during an ictal phase of generalized seizure with epileptiform activity (e) and during an interictal period with abnormal sharp waves (arrows; f). Two of three Slirk3−/− mice showed generalized seizures in the first 24 h of EEG recording. Epileptic seizures were never observed either electrographically or behaviorally in the three wild-type mice monitored. All three Slirk3−/− mice showed many sharp waves in the EEG during interictal periods. The mean frequencies ± s.e.m. of the sharp wave events were: wild-type: 1.3 ± 0.7; Slitrk3−/−: 60.7 ± 33.2 (17:00–19:00, light phase); wild-type: 3.7 ± 1.3; Slitrk3−/−: 116 ± 55.8 (2:00–4:00, dark phase). Data are presented as mean ± s.e.m.
Figure 7
Figure 7. PTPδ is a presynaptic binding partner for Slitrk3
(a–c) Slitrk3-Fc proteins specifically bound to PTPδ-expressing COS cells with high affinity. Kruskal-Wallis ANOVA, P< 0.0001, n> 65 cells each; *P< 0.01 compared with controls by Dunn’s pairwise post-hoc test in (b). Scatchard analysis, n> 25 cells each in (c). (d) PTPδ-Fc bound to Slitrk3 and all other Slitrk isoforms. Kruskal-Wallis ANOVA, P< 0.0001, n> 45 cells each; *P< 0.001 compared with HA-CD4 by Dunn’s pairwise post-hoc test. (e) Cultured hippocampal neurons were co-transfected at 13 DIV with YFP-PTPδ-expressing and mCherry-expressing vectors, and immunostained with VGAT and MAP2 at 15 DIV. Axons of transfected neurons can be detected as mCherry-positive and MAP2-negative thin protrusions. YFP-PTPδ expressed at low level in hippocampal aspiny neurons was concentrated in the soma and highly punctate in axons but hardly detected in dendrites. (f) Magnified images of the boxed region in (e). YFP-PTPδ puncta were colocalized with VGAT clusters at presynaptic boutons where mCherry-expressing axons contact with dendrites. (g) COS cells expressing Slitrk3-CFP induce YFP-PTPδ accumulation on contacting axons with VGAT. Neurons were co-tranfected with YFP-PTPδ and mCherry and then cocultured with COS cells expressing Slitrk3-CFP. Data are presented as mean ± s.e.m. Scale bars represent 40 μm (a, e, g), 10 μm (f) and 5 μm (inset of g).
Figure 8
Figure 8. Slitrk3 requires PTPδ for induction of inhibitory presynaptic differentiation
(a,b) Cultured hippocampal neurons were transfected at 0 DIV by Amaxa nucleofectionwith a vector co-expressing ECFP and either control shRNA (sh-con) or shRNA against PTPδ (sh-PTPδ). The transfected neurons were cocultured at 14 DIV with COS cells expressing Amigo-YFP (images not shown), Slitrk3-YFP (a) or YFP-NLG2 (b), and immunostained for VGAT at 15 DIV. A majority of axons (labeled with dephosphorylated tau) were transfected with shRNA-expressing vectors. COS cells expressing Slitrk3 induced little VGAT clustering along contacting axons of PTPδ knockdown neurons compared to contacting axons of control neurons (a). In contrast, COS cells expressing NLG2 induced VGAT clustering along contacting axons of PTPδ knockdown neurons as well as those of control neurons (b). (c) Total integrated intensity of VGAT staining on CFP-positive axons associated with COS cells expressing Amigo, Slitrk3 or NLG2 and not associated with MAP2 (images not shown) divided by the CFP-positive axon contact area. Kruskal-Wallis ANOVA, P< 0.0001, n = 30, 40 and 30 cells for Amigo-YFP, Slitrk3-YFP and YFP-NLG2, respectively; *P< 0.001 compared with sh-con by Dunn’s pairwise post-hoc test. n.s., not significant (P > 0.05). Data are presented as mean ± s.e.m. Scale bars represent 20 μm.

Similar articles

Cited by

References

    1. Huang ZJ, Di Cristo G, Ango F. Development of GABA innervation in the cerebral and cerebellar cortices. Nat Rev Neurosci. 2007;8:673–86. - PubMed
    1. Akerman CJ, Cline HT. Refining the roles of GABAergic signaling during neural circuit formation. Trends Neurosci. 2007;30:382–9. - PubMed
    1. Hensch TK. Critical period plasticity in local cortical circuits. Nat Rev Neurosci. 2005;6:877–88. - PubMed
    1. Maffei A, Nelson SB, Turrigiano GG. Selective reconfiguration of layer 4 visual cortical circuitry by visual deprivation. Nat Neurosci. 2004;7:1353–9. - PubMed
    1. Cline H. Synaptogenesis: a balancing act between excitation and inhibition. Curr Biol. 2005;15:R203–5. - PubMed

Publication types

MeSH terms

Substances