. 2011 May 12;70(3):510-21.
doi: 10.1016/j.neuron.2011.02.057.

Maturation of a recurrent excitatory neocortical circuit by experience-dependent unsilencing of newly formed dendritic spines

Affiliations

Maturation of a recurrent excitatory neocortical circuit by experience-dependent unsilencing of newly formed dendritic spines

Michael C Ashby et al. Neuron. .

Erratum in

  • Neuron. 2011 Jun 9;70(5):1020

Abstract

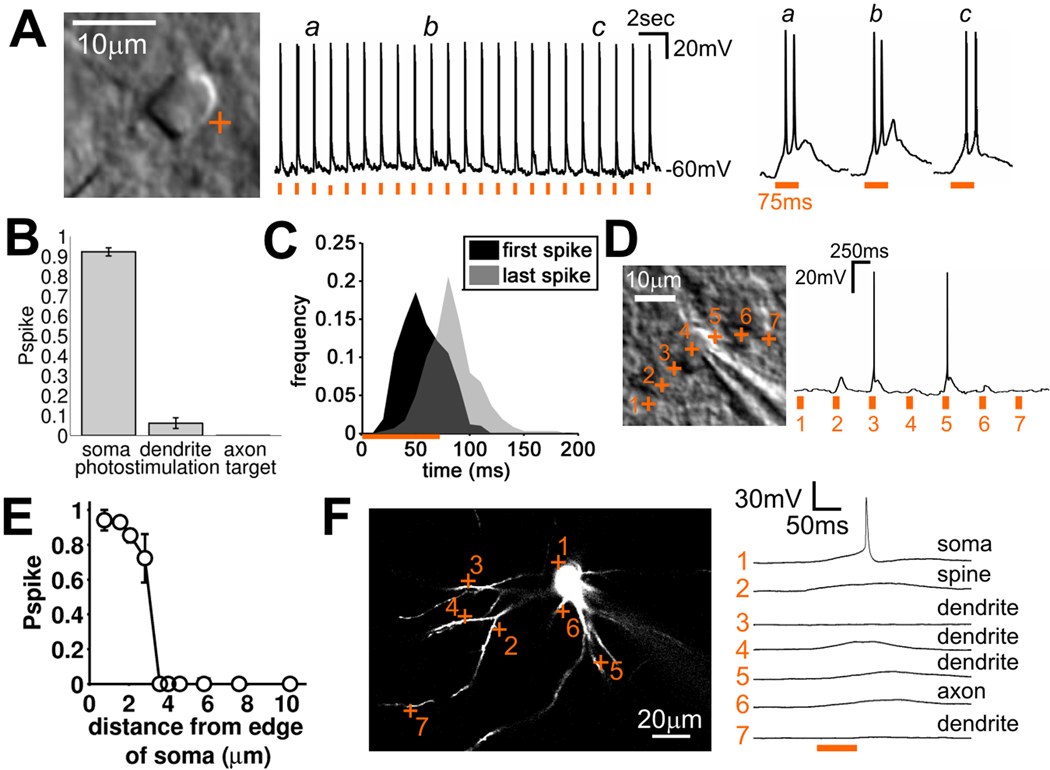
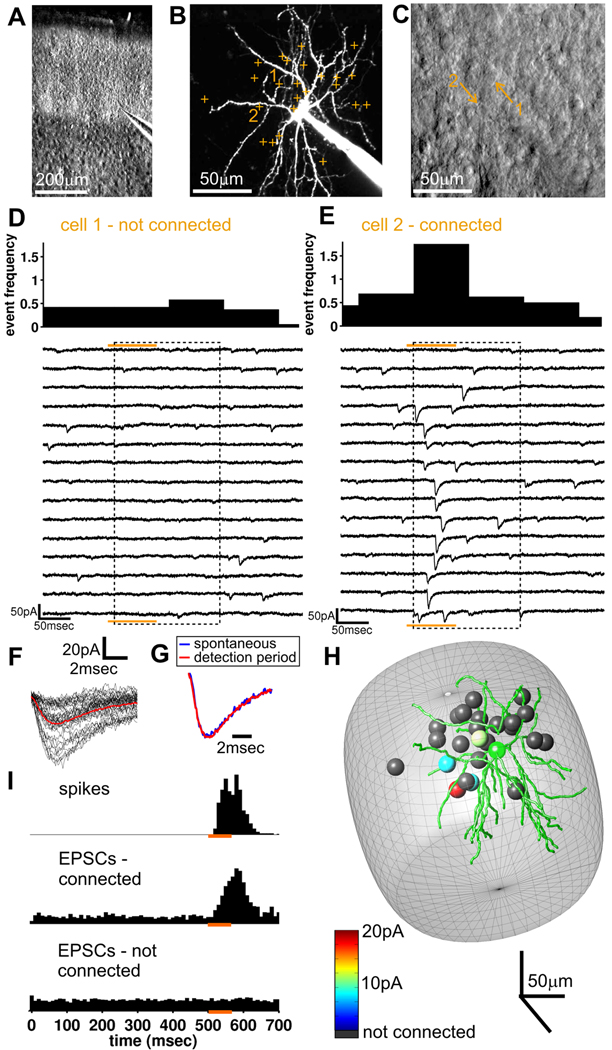
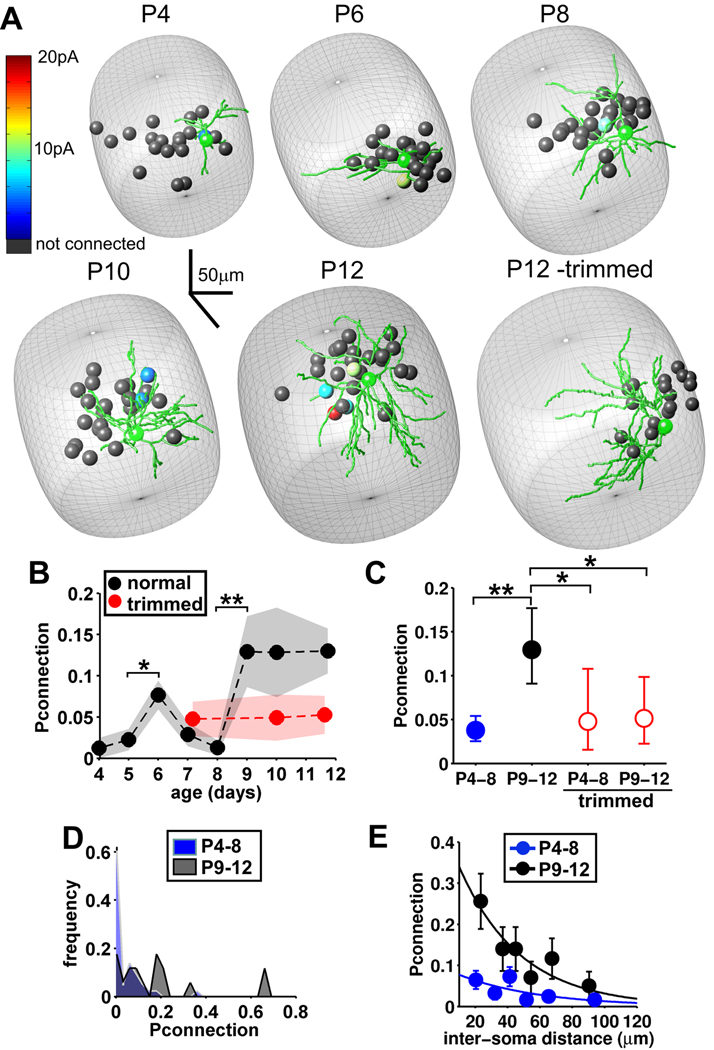
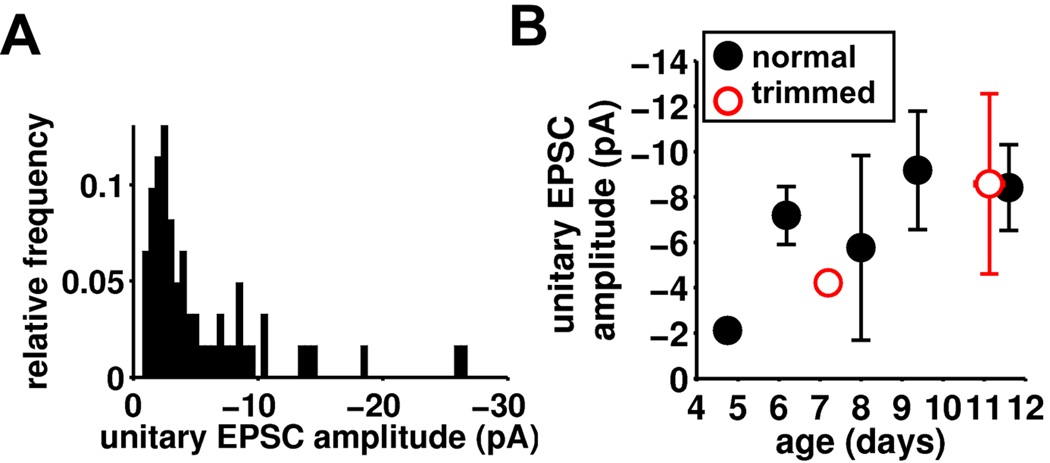
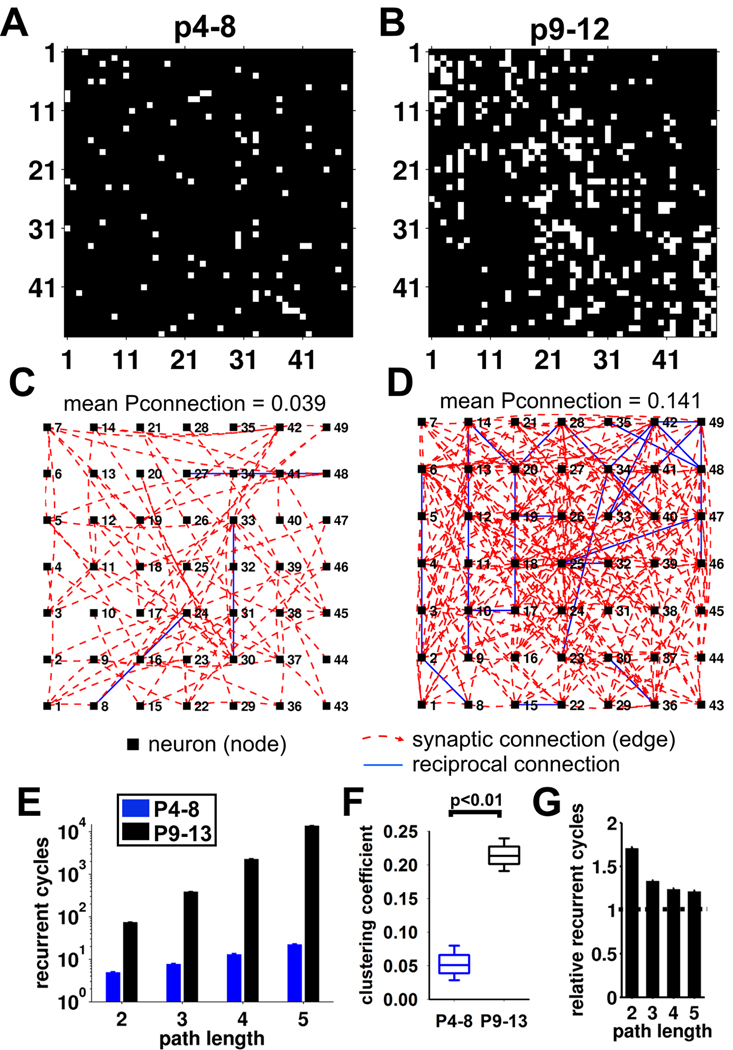
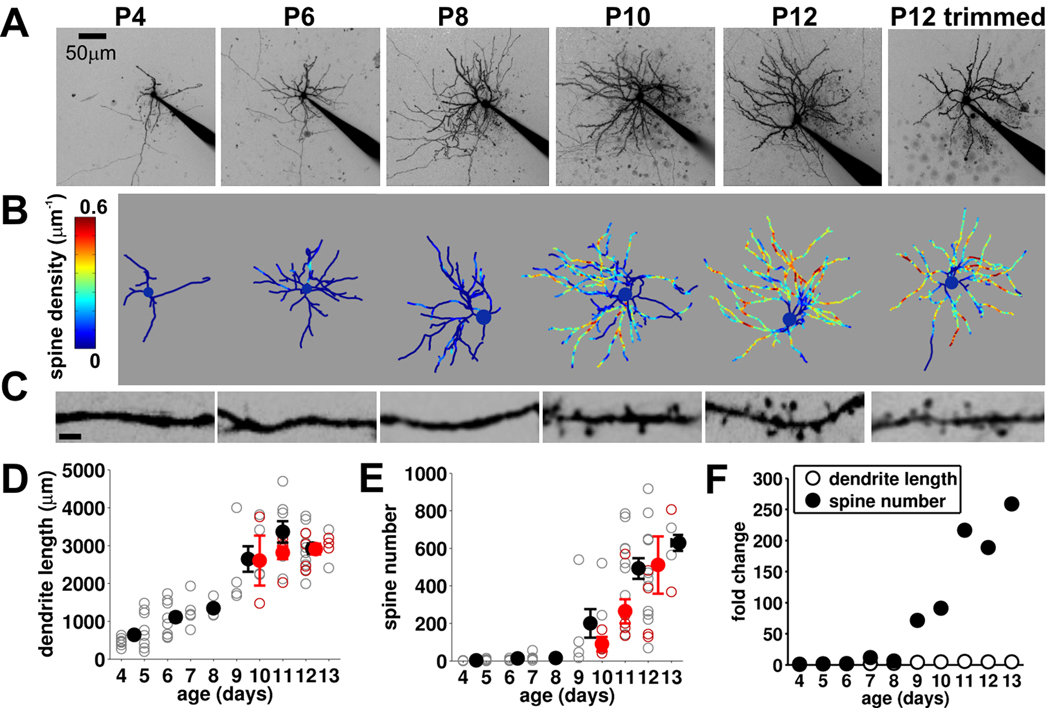
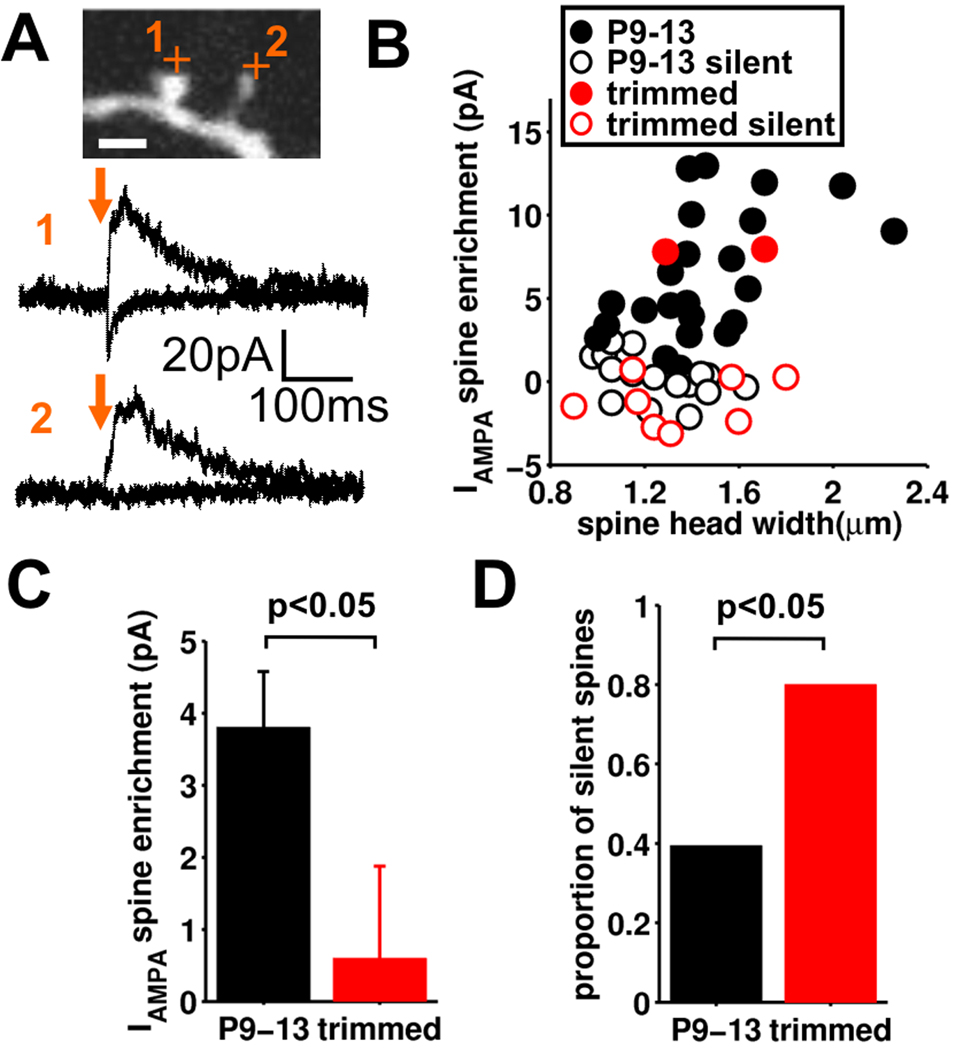
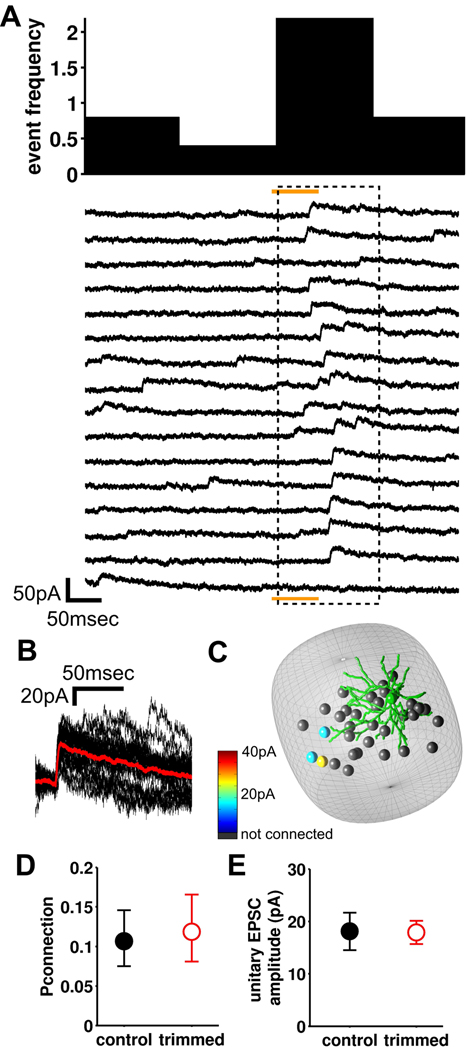
Local recurrent excitatory circuits are ubiquitous in neocortex, yet little is known about their development or architecture. Here we introduce a quantitative technique for efficient single-cell resolution circuit mapping using 2-photon (2P) glutamate uncaging and analyze experience-dependent neonatal development of the layer 4 barrel cortex local excitatory circuit. We show that sensory experience specifically drives a 3-fold increase in connectivity at postnatal day (P) 9, producing a highly recurrent network. A profound dendritic spinogenesis occurs concurrent with the connectivity increase, but this is not experience dependent. However, in experience-deprived cortex, a much greater proportion of spines lack postsynaptic AMPA receptors (AMPARs) and synaptic connectivity via NMDA receptors (NMDARs) is the same as in normally developing cortex. Thus we describe a approach for quantitative circuit mapping and show that sensory experience sculpts an intrinsically developing template network, which is based on NMDAR-only synapses, by driving AMPARs into newly formed silent spines.


Figures

Figure 1
Figure 1. Two photon glutamate uncaging reliably activates neurons with single cell resolution
(A) Dodt gradient contrast image of a recorded cell with photostimulation target indicated (left), response of this neuron to repeated photostimulation (center) and responses to photostimulation for the three indicated examples at higher time resolution (right; orange bars indicate photostimulation). (B) Probability of evoking an action potential by photostimulation targeting different neuronal structures (Pspike = 0.922, n = 70 cells for soma; 0.062, n = 58 locations from 8 cells for dendrite; 0, n = 14 locations from 8 cells for axon, mean ± 95% confidence limits). (C) Frequency histogram of latency to first action potential (black) and last action potential (gray) evoked by photostimulation (577 trials from 70 cells). (D) Dodt gradient contrast image of recorded cell with photostimulation targets at varying distances from the soma indicated (left) and the responses to the photostimulation evoked at those targets (right). (E) Probability of evoking an action potential vs. distance of photostimulation from the edge of the soma (data for all 3 spatial dimensions pooled; 97 locations from 10 cells). (F) 2PLSM image of recorded stellate cell (single z-plane) with photostimulation targets (left) and responses to photostimulation (right).
Figure 2
Figure 2. Mapping of synaptic connections using 2P photostimulation
(A) Dodt contrast image of barrel cortex slice. (B) 2P image of recorded cell (maximum projection) with all photostimulation targets indicated (corresponding to individual neuronal somata distributed in 3-D and targeted using Dodt contrast image). (C) Dodt contrast image (single focal plane) with two of the targets from b indicated. (D&E) Responses in the recorded cell to 15 trials for photostimulation of the two putative presynaptic neurons indicated in B & C (orange bar is photostimulation, dashed box is the detection period [defined in Figure 1C]). The binned frequency histogram for detected EPSCs is shown above the traces. Cell 1, shown in D, is not connected but for cell 2, in E, the appearance of EPSCs in the detection period indicates a synaptic connection to the recorded cell. (F) EPSCs from the detection period during photostimulation of presynaptic cell 2 (in E), aligned and superimposed (red is the average). (G) Scaled mean EPSCs from the detection period and mean sEPSC from same celld indicate that the kinetics of spontaneous and evoked EPSCs are indistinguishable. (H) 3-D map of connectivity for the recorded cell. Green is the reconstruction of the postsynaptic cell soma and dendrites. Other spheres represent putative presynaptic neurons tested using photostimulation with strength of connection color coded (4 were connected; slice from P12 animal). Cells are shown at their locations within the barrel (gray structure - estimated from the Dodt contrast image). (I) Time histogram showing action potential latency (top; same data as in Figure 1F) and EPSC event frequency before during and after photostimulation for all connections tested divided into connected (middle; 60 connections tested from 60 recordings) and unconnected (bottom; 983 connections tested from 60 recordings) cells.
Figure 3
Figure 3. Sensory experience drives an abrupt increase at P9 in stellate cell connectivity
(A) 3-dimensional maps of connectivity for the recorded cells from representative experiments throughout early development and from a deprived barrel at P12. Green is the reconstruction of the postsynaptic cell soma and dendrites. Other spheres represent putative presynaptic neurons tested using photostimulation with strength of connection color coded (4 were connected; slice from P12 animal). Cells are shown at their locations within the barrel (gray structure - estimated from the Dodt contrast image). (B) Connection probability (Pconnection, mean ±sem) at different ages in slices from control (black, normal whisker experience) and whisker-trimmed (red) animals (Control, n = P4, 1/81, 7; P5, 3/133, 10; P6, 18/235, 12; P7, 4/139,7; P8, 2/155,7; P9, 8/62, 5; P10, 5/39, 3; P11, 8/42, 4; P12, 12/112, 5 (age, connectivity, slices). Trimmed, n = P7–8, 5/105, 4; P10, 3/61,3; P11–12, 5/95, 8). (C) Pconnection data pooled as indicated (mean ± 95% confidence limits, P4–8: n = 28/743 connections tested, P9–13: n= 33/255, P4–8 trimmed: n=5/105, P9–12 trimmed: n = 8/156; statistics: Chi-squared test). (D) Frequency histogram of Pconnection for individual cells from P4–8 (blue, n=43) and P9–13 (black, n=17) control animals. (E) Mean Pconnection at different distances (binned) grouped into P4–8 and P9–12 (mean ± sem, P4–8, r2=0.483, p=0.024; P9–12 r2=0.842, p=0.010; single exponential fits, Spearman rank correlation).
Figure 4
Figure 4. Synaptic properties of the developing stellate cell connections
(A) Frequency histogram of unitary EPSC amplitude for all detected connections (normal whisker experience; n=60). (B) Binned ages vs unitary EPSC amplitude for control (black, n=60) and trimmed (red, n=13) animals.
Figure 5
Figure 5. The developmental increase in connectivity is predicted to produce a highly recurrent local circuit
(A&B) Example adjacency matrices for test (using the experimentally determined Pconnection-distance relationship) and matched random (same mean Pconnection but a random Pconnection-distance relationship) networks for (A) P4–8 and (B) P9–12. White pixels represent connected cells, black is not connected. (C&D) Network connection graphs for the adjacency matrices in A & B, respectively. Each node represents the spatial position of a neuron and synaptic connections are shown as dashed red lines (unidirectional – clockwise curve if the cell is presynaptic, anti-clockwise curve if the cell is postsynaptic) or blue (bidirectional – reciprocal). (E) Total number of recurrent cycles for path lengths from 2–5 in modeled networks generated from P4–8 and P9–12 experimental data (for each path length, p<0.001, P4–8 vs P9–12). (F) Box plot showing clustering coefficient from modeled P4–8 and P9–13 networks (median ± 95% confidence limits, box shows 25/75 percentiles). (G) Ratio of the number of recurrent cycles of path lengths 2–5 between experimental and matched random networks for P9–12 (mean ± sem).
Figure 6
Figure 6. Spinogenesis starting at P9 that is independent of experience
(A) 2P images (maximum projection, inverted contrast for display) of recorded stellate cells at ages indicated (electrode in situ). (B) Reconstructions of soma and dendrites for the same cells with spine density (color coded) superimposed. (C) High power images of representative sections of dendrites from same cells (scale bar, 2 µm). (D) Total dendritic length and (E) spine number vs. age for control (open gray, individual neurons; filled black, mean, n=65) and whisker trimmed (open red, individual neurons; filled red, mean, n=16). (F) Mean data (for control animals) expressed as fold change relative to P4–5 mean value for dendritic length and spine number.
Figure 7
Figure 7. Deprivation of sensory experience results in silencing of spines
(A) Example spine glutamate uncaging experiment showing neighboring AMPA receptor functional and AMPA receptor silent spine on a section of dendrite from a stellate cell (from an undeprived barrel). (B) Spine AMPA receptor current enrichment vs. spine head width for control (undeprived; black) and deprived (red). Open circles are those spines determined to be silent. (C) Pooled data for spine AMPA receptor current enrichment for control (undeprived; black, n=43) and deprived (red, n=10) (mean±sem). (D) The proportion of silent spines in control (undeprived, black) and deprived (red).
Figure 8
Figure 8. Synaptic connectivity via NMDARs in unchanged by perturbation of sensory experience
(A) Responses in a recorded cell voltage clamped at +40mV during consecutive photostimulation trials of a putative presynaptic neuron (orange bar is photostimulation, dashed box is the detection period). The binned frequency histogram for detected EPSCs is shown above the traces. Note the appearance of slowly-decaying outward NMDAR EPSCs in the detection period indicates a synaptic connection to the recorded cell. (B) EPSCs from the detection period, aligned and superimposed (red is the average). (C) 3-D map of connectivity for the recorded cell. (D) Average probability of connection from P9–12 control and trimmed animals (mean ± 95% confidence limits, control, n= 34/319, 11, 7; trimmed: n=29/245, 13, 7 (connected/tested cells, recorded cells, animals); Chis-quared test, p=0.76). (E) Mean unitary EPSC amplitude of connections in control and trimmed animals (mean±sem, control, n=34, trimmed, n=29).

Similar articles

Cited by

References

    1. Allen CB, Celikel T, Feldman DE. Long-term depression induced by sensory deprivation during cortical map plasticity in vivo. Nat Neurosci. 2003;6:291–299. - PubMed
    1. Bender KJ, Allen CB, Bender VA, Feldman DE. Synaptic basis for whisker deprivation-induced synaptic depression in rat somatosensory cortex. J. Neurosci. 2006;26:4155–4165. - PMC - PubMed
    1. Benshalom G, White EL. Quantification of thalamocortical synapses with spiny stellate neurons in layer IV of mouse somatosensory cortex. J Comp Neurol. 1986;253:303–314. - PubMed
    1. Bonifazi P, Goldin M, Picardo MA, Jorquera I, Cattani A, Bianconi G, Represa A, Ben-Ari Y, Cossart R. GABAergic hub neurons orchestrate synchrony in developing hippocampal networks. Science. 2009;326:1419–1424. - PubMed
    1. Braitenberg V, Schüz A. Cortex: Statistics and Geometry of Neuronal Connectivity. 2nd ed. Springer; 1998.

Publication types

MeSH terms

LinkOut - more resources