. 2011 Mar 14;208(3):519-33.
doi: 10.1084/jem.20102049. Epub 2011 Jan 31.

Mitochondrial reactive oxygen species promote production of proinflammatory cytokines and are elevated in TNFR1-associated periodic syndrome (TRAPS)

Affiliations

Mitochondrial reactive oxygen species promote production of proinflammatory cytokines and are elevated in TNFR1-associated periodic syndrome (TRAPS)

Ariel C Bulua et al. J Exp Med. .

Abstract

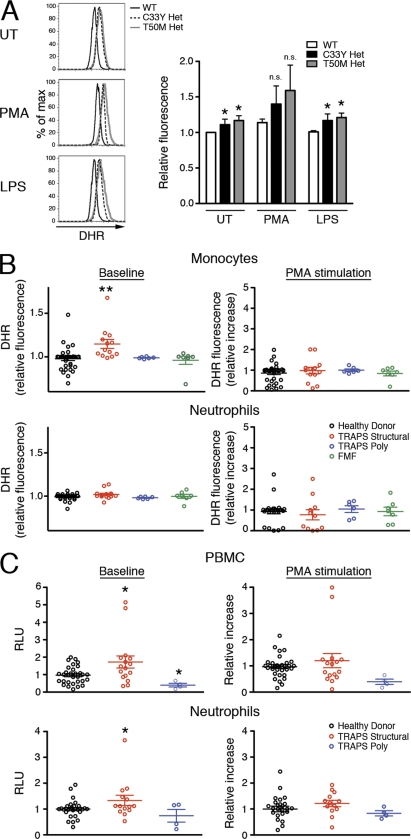
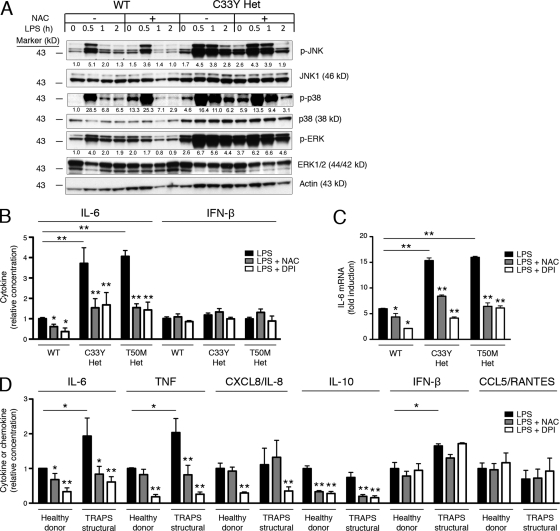
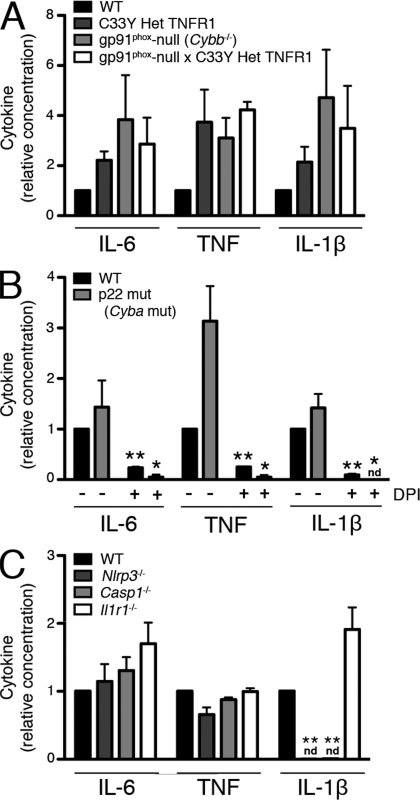
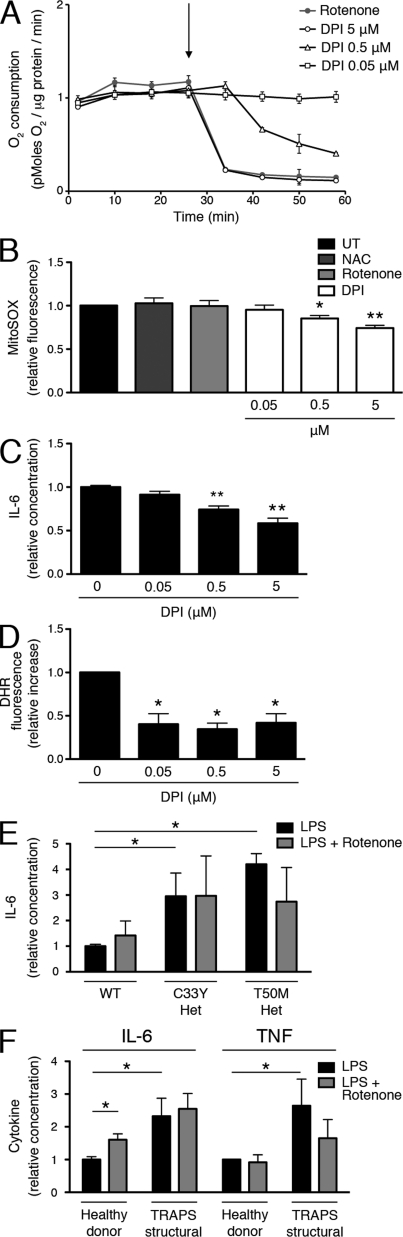
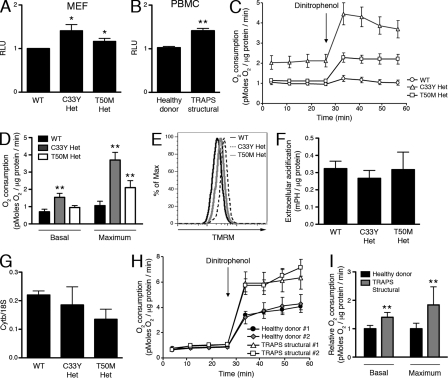
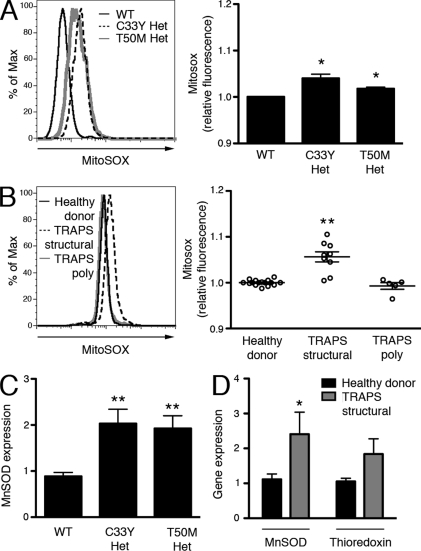
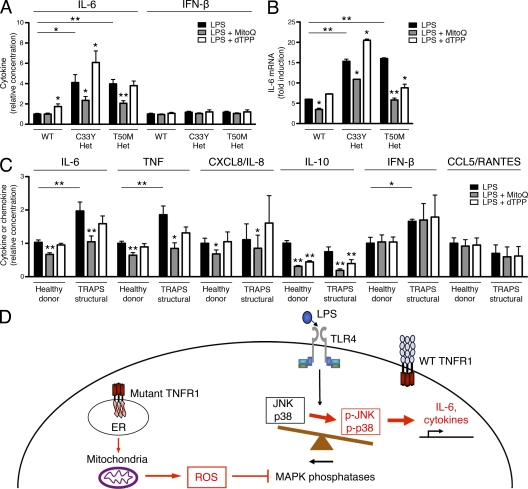
Reactive oxygen species (ROS) have an established role in inflammation and host defense, as they kill intracellular bacteria and have been shown to activate the NLRP3 inflammasome. Here, we find that ROS generated by mitochondrial respiration are important for normal lipopolysaccharide (LPS)-driven production of several proinflammatory cytokines and for the enhanced responsiveness to LPS seen in cells from patients with tumor necrosis factor receptor-associated periodic syndrome (TRAPS), an autoinflammatory disorder caused by missense mutations in the type 1 TNF receptor (TNFR1). We find elevated baseline ROS in both mouse embryonic fibroblasts and human immune cells harboring TRAPS-associated TNFR1 mutations. A variety of antioxidants dampen LPS-induced MAPK phosphorylation and inflammatory cytokine production. However, gp91(phox) and p22(phox) reduced nicotinamide adenine dinucleotide phosphate (NADPH) oxidase subunits are dispensable for inflammatory cytokine production, indicating that NADPH oxidases are not the source of proinflammatory ROS. TNFR1 mutant cells exhibit altered mitochondrial function with enhanced oxidative capacity and mitochondrial ROS generation, and pharmacological blockade of mitochondrial ROS efficiently reduces inflammatory cytokine production after LPS stimulation in cells from TRAPS patients and healthy controls. These findings suggest that mitochondrial ROS may be a novel therapeutic target for TRAPS and other inflammatory diseases.


Figures

Figure 1.
Figure 1.
Increased ROS in TNFR1 mutant cells and peripheral blood cells from TRAPS patients. (A) WT, C33Y TNFR1 heterozygous, and T50M TNFR1 heterozygous MEFs were left untreated (UT) or were treated with PMA or LPS for 1 h. Cells were incubated with DHR and ROS levels were determined by flow cytometry. Bar graph shows results of four independent experiments and histograms show one representative experiment. n.s., not significant. Error bars represent the mean ± SEM. (B) Monocytes and neutrophils from healthy donors (n = 27–31), TRAPS patients with structural mutations (TRAPS structural; n = 11–13), TRAPS patients with R92Q polymorphisms (TRAPS poly; n = 6), or patients with familial Mediterranean fever (FMF; n = 7) were treated for 1 h with or without PMA. Cells were incubated with DHR, and ROS levels were determined by flow cytometry. Data are from 10 experiments; each symbol represents a unique patient. (C) PBMCs and neutrophils from healthy donors (n = 25–33), TRAPS patients with structural mutation (TRAPS structural; n = 13–16) and TRAPS patients with R92Q or P46L polymorphisms (TRAPS poly; n = 4) were analyzed for superoxide production with a kinetic chemiluminescent assay in the presence or absence of PMA. Data are from 11 experiments; each symbol represents a unique patient. RLU, relative luminescence units. Data were normalized to the mean WT or healthy donor result for each experiment. *, P ≤ 0.05; **, P < 0.01.
Figure 2.
Figure 2.
Role of ROS in LPS-induced MAPK activation and cytokine production in normal and TNFR1 mutant cells. (A) WT and C33Y TNFR1 heterozygous MEFs were treated with or without NAC for 30 min, and further treated with LPS for the indicated time, after which JNK, p38, and ERK phosphorylation were measured by Western blot. Numbers shown are the density of each phosphoprotein relative to nonphosphorylated protein, normalized to the WT untreated sample. Actin is included as a loading control. Data are representative of three independent experiments. (B) WT, C33Y TNFR1 heterozygous, and T50M TNFR1 heterozygous MEFs were treated with LPS in the presence of the indicated antioxidants. IL-6 and IFN-β were measured in supernatants. Levels produced by WT MEFs after LPS stimulation ranged from 11.5–104.5 pg/ml (IL-6) and 13.5–23.0 pg/ml (IFN-β; n = 4 independent experiments). Data were normalized to the average WT result for each experiment. (C) IL-6 mRNA was measured by qRT-PCR in MEFs of the indicated genotype treated for 6 h with LPS and the indicated antioxidants, as in B. Data are shown as fold induction to LPS (as compared with untreated), and are representative of three experiments. (D) PBMCs from healthy donors (n = 5–6) and TRAPS patients with structural mutation (n = 4–7) were incubated with LPS and the indicated antioxidants, as in B. IL-6, TNF, CXCL8/IL-8, IL-10, IFN-β, and CCL5/RANTES were measured in supernatants. Levels produced by cells from healthy donors after LPS stimulation ranged from 2.36–9.98 ng/ml (IL-6), 0.21–2.04 ng/ml (TNF), 5.7–77.7 ng/ml (CXCL8/IL-8), 0.054–0.334 ng/ml (IL-10), 0.010–0.058 ng/ml (IFN-β), and 0.138–0.979 ng/ml (CCL5/RANTES; n = 3–5 independent experiments). Error bars represent the mean ± SEM. Data were normalized to the average healthy donor result for each experiment. *, P ≤ 0.05; **, P < 0.01.
Figure 3.
Figure 3.
NOX-derived ROS and the inflammasome are not required for LPS-induced cytokine production. (A) Peritoneal macrophages from mice of the indicated genotypes were stimulated with LPS for 6 h, and ATP for the final 15 min, before measuring IL-6, TNF, and IL-1β in the supernatants. Levels produced by WT mice after LPS stimulation ranged from 1.52–1.61 ng/ml (IL-6), 0.23–0.97 ng/ml (TNF), and 0.21–0.46 ng/ml (IL-1β; n = 2 independent experiments, 1 mouse in each group). (B) Peritoneal macrophages from mice of the indicated genotypes were incubated with LPS in the presence or absence of DPI for 6 h, and ATP for the final 15 min, before measuring IL-6, TNF, and IL-1β in the supernatants. Levels produced by WT mice after LPS stimulation ranged from 1.52–4.49 ng/ml (IL-6), 0.14–0.19 ng/ml (TNF), and 3.10–4.07 ng/ml (IL-1β; n = 3 independent experiments, one mouse in each group). (C) Peritoneal macrophages from mice of the indicated genotypes were stimulated with LPS for 6 h, and ATP for the final 15 min, before measuring IL-6, TNF, and IL-1β in the supernatants. Levels produced by WT mice after LPS stimulation ranged from 1.68–2.70 ng/ml (IL-6), 0.39–0.58 ng/ml (TNF), and 0.18–0.80 ng/ml (IL-1β; n = 3 independent experiments, one mouse in each group). nd, not detectable. Error bars represent the mean ± SEM. Data were normalized to the average WT LPS result for each experiment. *, P ≤ 0.05; **, P < 0.01.
Figure 4.
Figure 4.
Inhibition of mitochondrial oxygen consumption by DPI. (A) The effect of antioxidants on oxygen consumption rate was measured in WT MEFs with a Seahorse Bioscience XF Analyzer. The arrow indicates time of addition of the antioxidants. A representative plot (n = 3) is shown. (B) WT MEFs were incubated with the indicated antioxidants for 1 h or were left untreated and then stained with MitoSOX Red, and ROS levels were determined by flow cytometry. Data were normalized to the untreated result (n = 3 independent experiments). (C) WT MEFs were treated with LPS and the indicated concentrations of DPI, after which IL-6 was measured in supernatants. Levels of IL-6 were normalized to the LPS alone result, which ranged from 0.284–0.321 ng/ml (n = 3 independent experiments). (D) WT MEFs were treated with PMA and the indicated concentrations of DPI for 1 h. Cells were incubated with DHR, and ROS levels were determined by flow cytometry. Data were normalized to the increase in fluorescence (as compared with untreated) of the PMA alone sample for each experiment (n = 3 independent experiments). (E) WT, C33Y TNFR1 heterozygous, and T50M TNFR1 heterozygous MEFs were treated with LPS in the presence or absence of rotenone, after which IL-6 was measured in supernatants. IL-6 levels were normalized to the WT LPS alone result, which ranged from 11.5–104.5 pg/ml (n = 4 independent experiments). (F) PBMCs from healthy donors (n = 6) and TRAPS patients with structural mutations (n = 6) were incubated with LPS in the presence or absence of rotenone, after which IL-6 and TNF were measured in the supernatants. IL-6 and TNF levels were normalized to the healthy donor LPS alone result, which ranged from 1.31–2.28 ng/ml (IL-6) and 0.274–0.661 ng/ml (TNF; n = 6 independent experiments). Error bars represent the mean ± SEM.
Figure 5.
Figure 5.
Increased ATP levels and oxidative capacity in cells with TRAPS-associated TNFR1 mutations. (A) ATP level was measured in WT and TNFR1 mutant MEFs. Cell numbers were determined with a CyQuant assay, and data were normalized to the WT result (n = 5 independent experiments). RLU, relative luminescence units. (B) ATP level was measured in PBMCs from healthy donors (n = 8) and TRAPS patients with structural mutations (n = 6). Cell numbers were determined with a CyQuant assay, and data were normalized to the healthy donor result (n = 4 independent experiments). RLU, relative luminescence units. (C) Oxygen consumption was measured in WT, C33Y TNFR1 heterozygous, and T50M TNFR1 heterozygous MEFs using the Seahorse Bioscience XF Analyzer. Dinitrophenol was added as indicated by the arrow. A representative plot (n = 3) is shown. (D) Basal and maximum oxygen consumption were determined in MEFs of the indicated genotypes using the Seahorse Bioscience XF Analyzer (n = 3 independent experiments). (E) TMRM staining of WT, C33Y TNFR1 heterozygous, and T50M TNFR1 heterozygous MEFs was determined by flow cytometry. A representative histogram (n = 3) is shown. (F) Extracellular acidification was measured in WT, C33Y TNFR1 heterozygous, and T50M TNFR1 heterozygous MEFs using the Seahorse Bioscience XF Analyzer (n = 3 independent experiments). (G) Mitochondrial copy number was measured by qRT-PCR in MEFs of the indicated genotypes. Cytb mitochondrial DNA was compared with 18S genomic DNA (n = 2 independent experiments). (H) Oxygen consumption was measured in PBMCs from healthy donors (n = 10) and patients with TRAPS structural mutations (n = 6) using the Seahorse Bioscience XF Analyzer. Dinitrophenol was added as indicated by the arrow. A representative plot with two healthy donors and two TRAPS patients with structural mutations is shown (n = 5 independent experiments). (I) Basal and maximum oxygen consumption were determined from healthy donors (n = 10) and TRAPS patients with structural mutations (TRAPS structural; n = 6) using the Seahorse Bioscience XF Analyzer. Error bars represent the mean ± SEM. Data were normalized to the average healthy donor result (n = 5 independent experiments). *, P ≤ 0.05; **, P < 0.01.
Figure 6.
Figure 6.
Mitochondrial superoxide production is increased in TRAPS. (A) WT, C33Y TNFR1 heterozygous, and T50M TNFR1 heterozygous MEFs were incubated with MitoSOX Red for 1 h and ROS levels were determined by flow cytometry. Histogram shows representative staining and bar graph shows results of three independent experiments. Data were normalized to the average WT result for each experiment. (B) Monocytes from healthy donors (n = 15), TRAPS patients with structural mutations (TRAPS structural; n = 9), and TRAPS patients with TNFR1 polymorphisms (TRAPS poly; n = 5) were incubated with MitoSOX Red for 1 h, and ROS levels were determined by flow cytometry. Histogram shows representative staining and bar graph shows results of six independent experiments; each symbol represents a unique patient. Data were normalized to the average healthy donor result for each experiment. (C) SOD2 mRNA was measured by qRT-PCR in MEFs of the indicated genotype (n = 3 independent experiments). Data represent gene expression relative to β2-microglobulin. (D) SOD2 and thioredoxin mRNA were measured by qRT-PCR in PBMCs from healthy donors (n = 6–7) and TRAPS patients with structural mutations (n = 14). Data represent gene expression relative to β2-microglobulin. Error bars represent the mean ± SEM. *, P ≤ 0.05; **, P < 0.01.
Figure 7.
Figure 7.
Inhibition of mitochondrial ROS can reduce normal cytokine production and reverse hyperinflammatory responses in TRAPS. (A) WT, C33Y TNFR1 heterozygous, and T50M TNFR1 heterozygous MEFs were treated with LPS in the presence of the mitochondrial ROS scavenger MitoQ and its control, dTPP. IL-6 and IFN-β were measured in supernatants. Levels produced by WT MEFs after LPS stimulation ranged from 11.5–104.5 pg/ml (IL-6) and 13.5–23.0 pg/ml (IFN-β; n = 3 independent experiments). (B) IL-6 mRNA was measured by qRT-PCR in MEFs of the indicated genotype treated for 6 h with LPS and the indicated reagents as in A. Data are shown as fold induction to LPS (as compared with untreated), and are representative of three independent experiments. (C) PBMCs from healthy donors (n = 5–8) and TRAPS patients with structural mutations (TRAPS structural; n = 4) were incubated with LPS and the indicated reagents as in A. IL-6, TNF, CXCL8/IL-8, IL-10, IFN-β, and CCL5/RANTES were measured in supernatants. Levels produced by PBMCs from healthy donors after LPS stimulation ranged from 0.93–8.67 ng/ml (IL-6), 1.17–4.12 ng/ml (TNF), 5.7–77.7 ng/ml (CXCL8/IL-8), 0.054–0.334 ng/ml (IL-10), 0.010–0.058 ng/ml (IFN-β), and 0.138–0.979 ng/ml (CCL5/RANTES; n = 3–4 independent experiments). Data were normalized to the average WT or healthy donor LPS result for each experiment. *, P ≤ 0.05; **, P < 0.01. (D) Schematic model of how mitochondrial ROS support LPS hyperresponsiveness in TRAPS.

Comment in

Similar articles

Cited by

References

    1. Balaban R.S., Nemoto S., Finkel T. 2005. Mitochondria, oxidants, and aging. Cell. 120:483–495 10.1016/j.cell.2005.02.001 - DOI - PubMed
    1. Burek C.L., Rose N.R. 2008. Autoimmune thyroiditis and ROS. Autoimmun. Rev. 7:530–537 10.1016/j.autrev.2008.04.006 - DOI - PubMed
    1. Bylund J., MacDonald K.L., Brown K.L., Mydel P., Collins L.V., Hancock R.E., Speert D.P. 2007. Enhanced inflammatory responses of chronic granulomatous disease leukocytes involve ROS-independent activation of NF-kappa B. Eur. J. Immunol. 37:1087–1096 10.1002/eji.200636651 - DOI - PubMed
    1. Capasso M., Bhamrah M.K., Henley T., Boyd R.S., Langlais C., Cain K., Dinsdale D., Pulford K., Khan M., Musset B., et al. 2010. HVCN1 modulates BCR signal strength via regulation of BCR-dependent generation of reactive oxygen species. Nat. Immunol. 11:265–272 10.1038/ni.1843 - DOI - PMC - PubMed
    1. Cárdenas C., Miller R.A., Smith I., Bui T., Molgó J., Müller M., Vais H., Cheung K.H., Yang J., Parker I., et al. 2010. Essential regulation of cell bioenergetics by constitutive InsP3 receptor Ca2+ transfer to mitochondria. Cell. 142:270–283 10.1016/j.cell.2010.06.007 - DOI - PMC - PubMed

Publication types

MeSH terms